Cartoon Theme Bar Graph – Product Introduction and Marketing Strategy
RJ0300072_25
- Last Update 05/08/2025
- File Size 0.2MB
- # of Slides 2
- File Format PPTX
- Slide Ratio 16:9
- Color
Keywords
- #Content-Based Slides
- #Design-Based Slides
- #Product/Service Introduction
- #Marketing Plan and Strategy
- #Graph
- #Differentiation Strategy for Products/Services
- #Key Marketing Activities
- #Horizontal Bar
- #Segmented Horizontal Bar
- #16:9
- #horizontal bar chart PowerPoint
- #segmented graph template
- #cartoon theme slide
- #data comparison chart
- #marketing presentation slide
About the Product
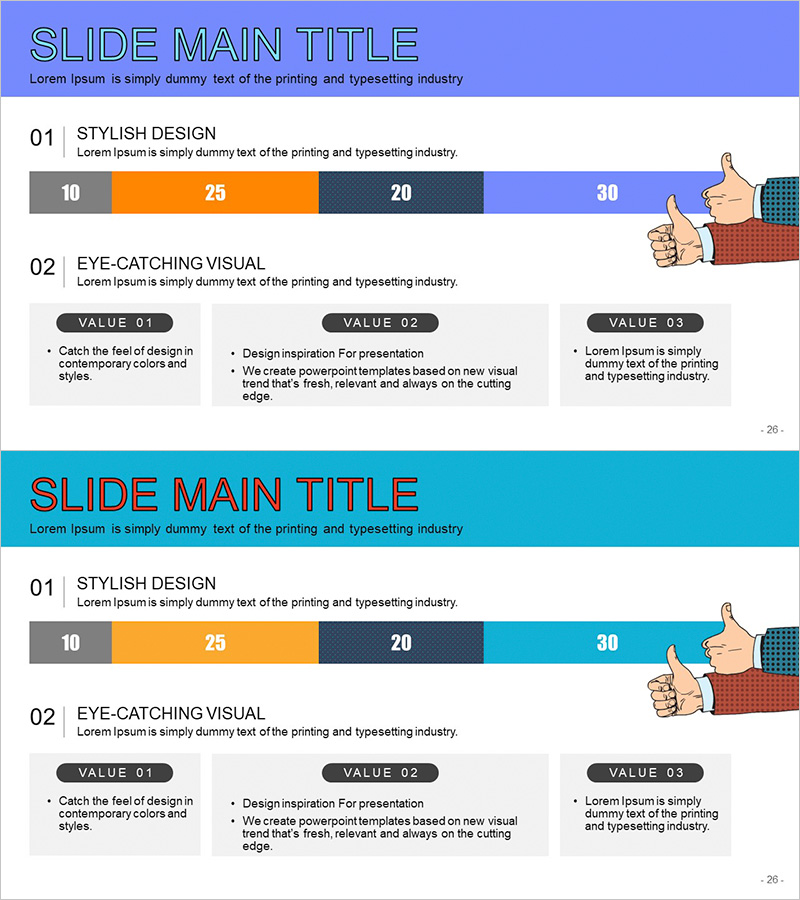
A 4-item horizontal bar chart PowerPoint slide with cartoon theme design. Features orange, gray, navy, and purple color segments optimized for numerical comparison and ranking visualization in product introduction and marketing strategy presentations. The 2-slide set includes data visualization on the first slide and three key-point emphasis boxes on the second. Friendly thumbs-up illustrations and grid patterns add visual interest to your presentation deck. Fully editable PPTX format ready for immediate use.
Usage Points
-
Main Usage
Visually compare four data points—such as product performance, sales volume, or market share—using horizontal bars, while highlighting three core marketing strategy points in emphasis boxes. The cartoon theme creates an approachable, engaging atmosphere suitable for both B2B and B2C presentations.
-
How to Use
Replace the bar lengths and numerical values on slide 1 with your own data. Edit the VALUE 01, 02, and 03 boxes on slide 2 with your marketing strategy highlights. Customize colors and fonts to match your corporate brand. Insert into product presentations, marketing plans, or quarterly performance reports.
-
Recommended For
Marketing managers, product planners, and sales teams presenting market analysis, competitive comparisons, or sales strategies. Also effective for educational and seminar materials visualizing learning outcomes, survey results, or performance metrics.
-
Slide Structure
Slide 1: Title area + 4-segment horizontal bar chart (values 10, 25, 20, 30) + thumbs-up illustration. Slide 2: Title area + 3 key-point boxes (VALUE 01, 02, 03) + bullet-point descriptions. 16:9 aspect ratio, 2-slide PPTX format.
Related Products
-

Main Marketing Activities for Camping Business – Visually Appealing Infographic
#Product/Service Introduction #Marketing Plan and Strategy #Diagram
-

Business Support Strategy Arrow Diagram – A Guide for Global Business Synergies
#Product/Service Introduction #Marketing Plan and Strategy #Diagram
-

Digital Learning in the Natural Environment Slide – Creative Marketing Strategy
#Marketing Plan and Strategy #Other #Target Setting
-

Adventure Business Goals Diagram – Key for Strategic Approach
#Product/Service Introduction #Marketing Plan and Strategy #Diagram
