Data Analytics Company Overview Slide – Effective Information Visualization
RJ0300070_21
- Last Update 05/08/2025
- File Size 5.8MB
- # of Slides 2
- File Format PPTX
- Slide Ratio 16:9
- Color
Keywords
About the Product
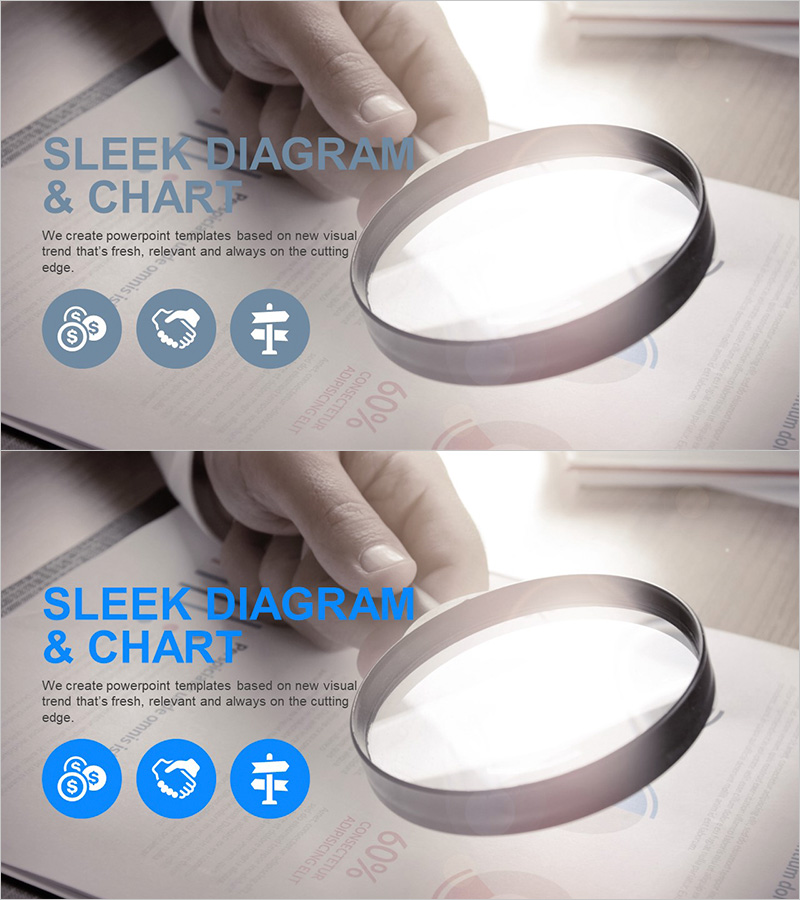
A 2-slide PowerPoint presentation designed to effectively communicate key company information for data analytics and business enterprises. Featuring a light gray background with blue title text and three strategically placed icons (finance, partnership, trust), this minimalist layout presents corporate values and vision at a glance. The slide combines visual elements with text description areas, making it immediately applicable for investor pitches, partner meetings, and employee onboarding presentations. Available in 16:9 widescreen PPTX format, fully editable across all PowerPoint versions.
Usage Points
-
Main Usage
Clearly communicate your company's core values and vision through icons and text. This slide emphasizes key corporate strengths such as financial stability, partnership capability, and trustworthiness, effectively building credibility with investors and business partners.
-
How to Use
Insert this slide in the overview section of your company introduction presentation, immediately following the company introduction. Customize the text areas beneath each icon with your company's specific strengths and business focus, and update the title area with your company name or section heading to match your presentation context.
-
Recommended For
Ideal for company introduction presentations in data analytics, IT, finance, and consulting sectors. Suitable for investor relations (IR) materials, employee onboarding training decks, and partner meeting presentations. Particularly effective when emphasizing corporate credibility and professional expertise.
-
Slide Structure
2-slide format with each slide featuring a blue title area at the top (accommodating approximately 40 characters) and three icon sections in the center. Each icon is accompanied by a text input area below (approximately 100 characters) for describing three core company values in a hierarchical structure.
Related Products
-

Timepiece Theme Company Overview - Business Insights and Presentation
#Company Introduction #Business Introduction #Diagram
-

Company Overview Plus Diagram – Vision and Strategy
#Company Introduction #Business Introduction #Business Vision and Strategy
-

Mobile Service Business Overview – Utilizing Modern Diagrams
#Company Introduction #Business Introduction #Diagram
-

Square Diagram for Effective Company Presentation – Cluster Format
#Company Introduction #Business Introduction #Diagram
