IT Intra Service Overlay Diagram - Service Description and Connections
RJ0300052_13
- Last Update 05/02/2025
- File Size 4.3MB
- # of Slides 2
- File Format PPTX
- Slide Ratio 16:9
- Color
Keywords
- #Content-Based Slides
- #Design-Based Slides
- #Product/Service Introduction
- #Diagram
- #Features
- #Product and Service Overview
- #Cluster
- #Combination Diagram
- #16:9
- #overlay diagram PowerPoint
- #Venn diagram slide template
- #IT service architecture
- #5-node cluster diagram
- #service connection presentation
- #how to create overlay diagram in PowerPoint
About the Product
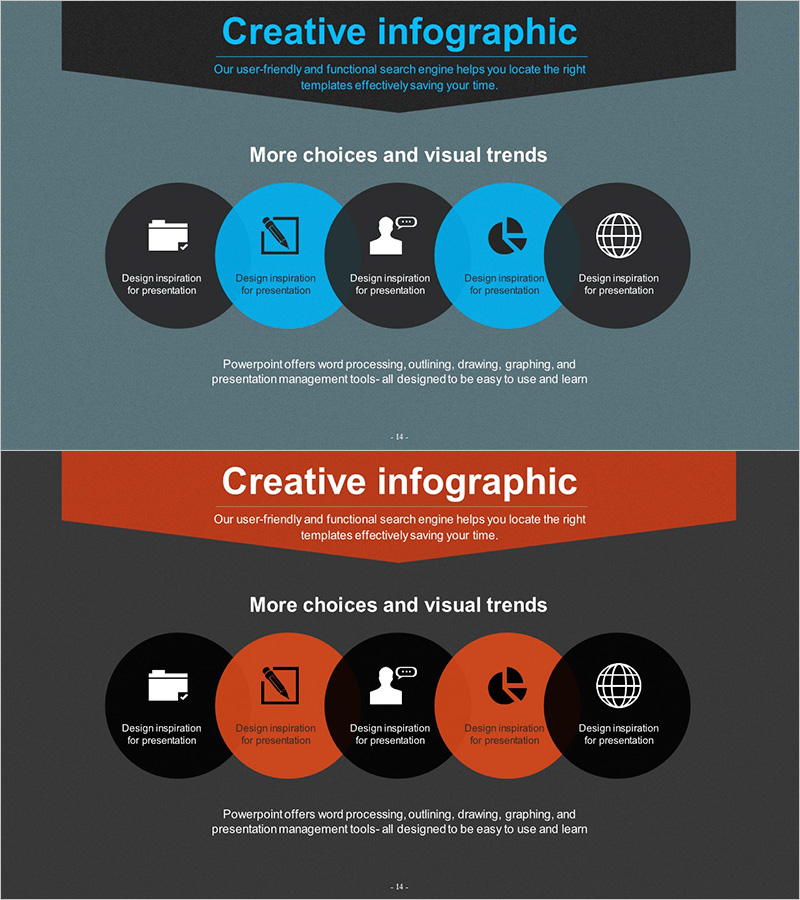
A professional overlay diagram PowerPoint slide that visualizes relationships and connection structures between IT infrastructure services. Five circular nodes are arranged in a Venn diagram format to clearly represent overlapping and shared functionality across different service areas. The dark background with blue and black nodes creates a technical, authoritative tone suitable for IT presentations. Each node accommodates icons and text labels, making it adaptable for organizational hierarchies, service portfolios, technology stack mappings, and system architecture documentation. The 2-slide set provides color variations and is optimized for 16:9 widescreen format in modern presentation environments.
Usage Points
-
Main Usage
Visualizes interconnected elements such as IT infrastructure, cloud services, and organizational structures. The overlay format simultaneously expresses both the independence of each domain and their shared areas, enabling intuitive explanation of complex system architectures.
-
How to Use
Enter service names, functions, or department titles into each circular node and add icons as needed. Modify colors to distinguish priorities or categories, and adjust node count to accommodate 3–7 items. Use in technology briefings, system integration proposals, organizational restructuring presentations, and infrastructure planning meetings.
-
Recommended For
IT departments, technology planning teams, systems integration (SI) companies, cloud service providers, and digital transformation leaders. Ideal for CTO presentations, development team leads, solution architects, and infrastructure managers presenting to executive stakeholders and clients.
-
Slide Structure
2-slide set with the first featuring five blue nodes in an overlapping Venn diagram configuration and the second providing an orange node color variation. Each node is independently editable with clearly defined central overlap areas and distinct outer regions.
Related Products
-

Red Purple Paint Brush and Icon Slide – Product and Service Introduction
#Product/Service Introduction #Diagram #Features
-

Furniture Company Core Competency Diagram
#Product/Service Introduction #Business Vision and Strategy #Diagram
-

PowerPoint Slide for Study Abroad Country Comparison
#Product/Service Introduction #Market and Competitor Analysis #Features
-

Key Clients in Furniture Business – Flow of Design Inspiration
#Product/Service Introduction #Customer Success Stories #Diagram
