Vertical Bar Graph Template for Competitor Analysis
RJ0300051_12
- Last Update 05/02/2025
- File Size 3.1MB
- # of Slides 2
- File Format PPTX
- Slide Ratio 16:9
- Color
Keywords
About the Product
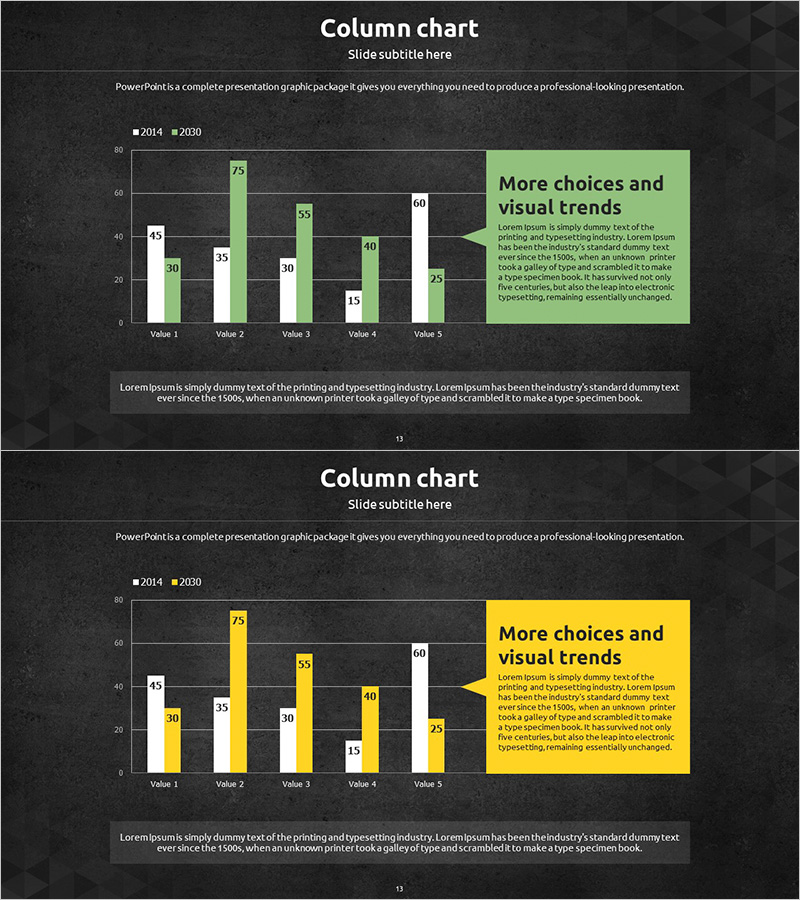
A free vertical bar chart PowerPoint slide designed for competitor analysis and market comparison. This presentation slide features a dark gray background with two color options—green and yellow—allowing you to compare data across five categories over time. Simply replace the category names and values with your own data, and the slide is ready to use immediately in business plans, investor pitch decks, marketing presentations, and reports. The right-side highlight box lets you emphasize key insights, and the entire slide is fully editable in PowerPoint. Explore more chart slide templates and graph variations on GoodPello.
Usage Points
-
Main Usage
Visualize competitor analysis, market trends, and year-over-year performance comparisons by displaying two data series side-by-side across multiple categories.
-
How to Use
Replace the category labels (Value 1–5) and numerical values with your own data. Select either the green or yellow color version to match your presentation theme, then add your key insight in the right-side text box.
-
Recommended For
Business professionals, executives, marketing managers, and analysts who need to present competitive positioning, market analysis, or performance metrics in business plans, investor presentations, marketing strategies, and annual reports.
-
Slide Structure
Single-slide layout with a vertical column chart on the left (5 categories, 2 data series) and a text highlight box on the right. Legend and data labels are clearly displayed for easy interpretation.
