Idea Development Status by Country – Global Network Analysis
RJ0300045_26
- Last Update 04/30/2025
- File Size 2MB
- # of Slides 2
- File Format PPTX
- Slide Ratio 16:9
- Color
Keywords
About the Product
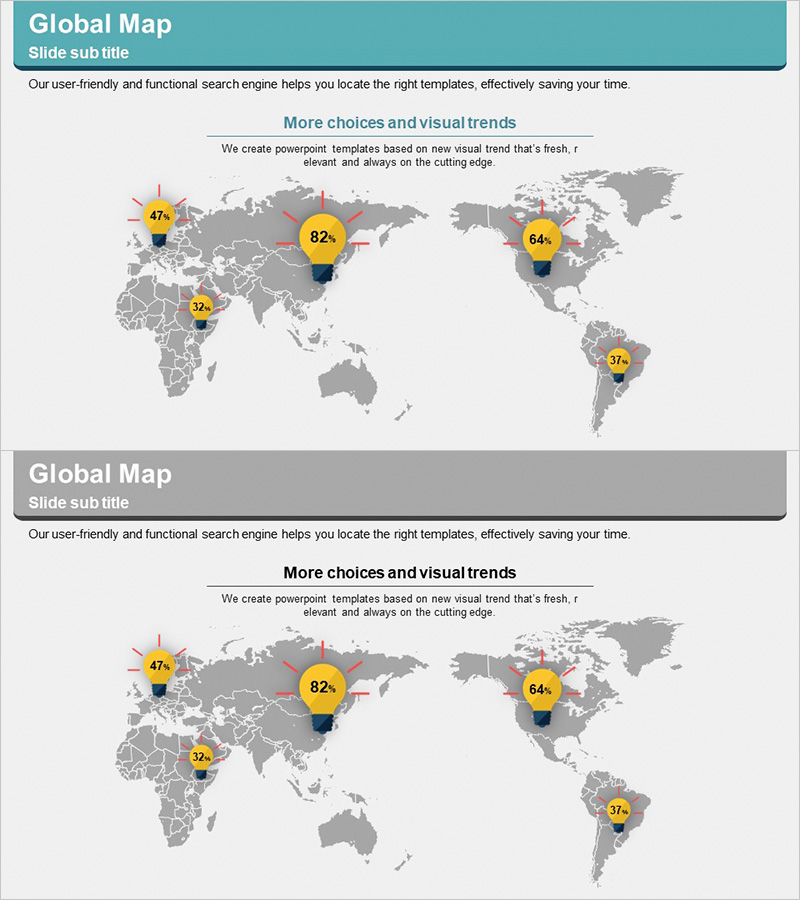
A professional PowerPoint slide featuring a world map with data visualization for five key regions. This presentation template displays percentage metrics using circular charts and numerical indicators overlaid on a global map, making it ideal for international market analysis, global network reporting, and regional performance comparison. The design combines a teal header with a gray-toned map background, creating a business-appropriate aesthetic. Offered in two color variations (teal and gray), this 2-slide PPTX template is fully editable and ready for investor presentations, quarterly business reports, and strategic market planning.
Usage Points
-
Main Usage
Visualize international market conditions, regional performance metrics, and global network expansion using map-based data representation. Communicate global business strategy and regional market status clearly to investors, partners, and stakeholders for informed decision-making.
-
How to Use
Input percentage data for five regions on the world map to represent market share, sales performance, or customer distribution by country. Customize header text and descriptive content to adapt the slide for market analysis reports, global expansion strategy presentations, or regional growth initiatives.
-
Recommended For
Ideal for executives, marketing teams, and sales professionals in international businesses presenting global market conditions. Suitable for investor pitch decks, quarterly business reports, regional performance analysis, and global partnership negotiation materials.
-
Slide Structure
Two-slide template with teal header and gray header variations. Each slide includes a title section, world map visualization area, five regional circular chart indicators with percentage displays, and a descriptive text area at the bottom for context and insights.
Related Products
-

Simple Circle Presentation Template Global Map – Global Market Analysis
#Company Introduction #Market and Competitor Analysis #Other
-

Global Target Country Map – Essential Tool for Market Analysis
#Company Introduction #Market and Competitor Analysis #Other
-

Global Market Targeting for Mobile Apps Slide
#Company Introduction #Market and Competitor Analysis #Other
-

Visualizing Key Targets in the Global Market Slide Template
#Company Introduction #Market and Competitor Analysis #Other
