Visualizing Company Vision with History Layer Diagram
RJ0300037_17
- Last Update 04/27/2025
- File Size 0.9MB
- # of Slides 2
- File Format PPTX
- Slide Ratio 16:9
- Color
Keywords
- #Content-Based Slides
- #Design-Based Slides
- #Company Introduction
- #Marketing Plan and Strategy
- #Diagram
- #History
- #Marketing Objectives
- #Structure
- #Pyramid Chart
- #16:9
- #layer diagram PowerPoint
- #company history timeline slide
- #4-stage timeline diagram
- #business vision visualization PPT
- #gradient diagram slide template
About the Product
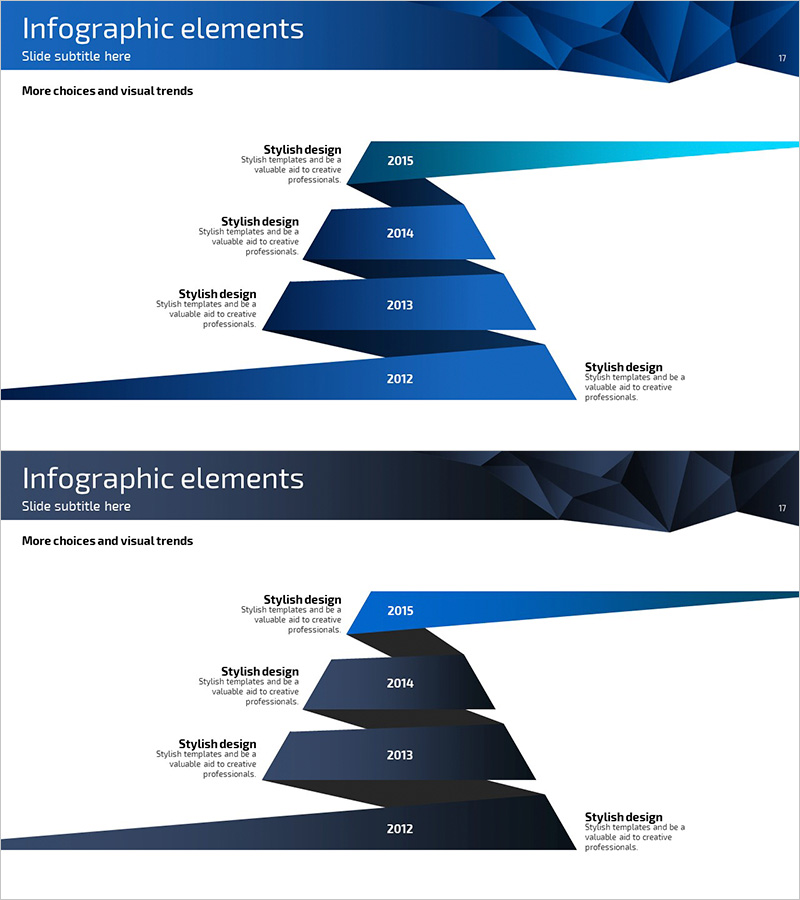
A 4-stage layered diagram PowerPoint slide that visualizes company history and vision progression over time. The gradient color transition from dark blue to light blue emphasizes temporal flow, with dedicated text description areas for each stage. Delivered as a 2-slide set featuring a unified header design and main diagram layout, ready for immediate use in presentations. Ideal for company profiles, marketing plans, business reports, and investor pitches where you need to showcase company evolution, growth milestones, or strategic roadmaps.
Usage Points
-
Main Usage
Optimized for presenting company historical development stages, growth processes, and strategic milestones in chronological order. Each stage's key achievements, events, and transitions are visualized hierarchically with text, enhancing audience comprehension and engagement.
-
How to Use
Apply to company profile history sections, marketing plan brand evolution narratives, and business report growth stage explanations. Input years, key events, and achievements into each layer's text area, and adjust colors as needed to match your presentation context and branding.
-
Recommended For
Corporate executives, marketing professionals, business development teams, and investor relations specialists presenting company growth trajectories. Particularly effective for startups explaining growth stages, large enterprises detailing business expansion, and organizations communicating organizational restructuring history.
-
Slide Structure
2-slide set with slide 1 featuring a header design (dark blue geometric pattern background) and slide 2 displaying the 4-stage layered diagram. Each stage is shaped as a trapezoid overlapping the previous one, with text description areas on the left and year/title areas on the right. Colors transition from dark blue (2012) through medium blue (2013), light blue (2014), to cyan (2015) in gradient progression.
Related Products
-

Camping Icon Pyramid Structure Diagram - Structuring Marketing Plans
#Marketing Plan and Strategy #Diagram #Marketing Objectives
-

Marketing Objectives Layered 3D Diagram – Strategic Goal Visualization
#Product/Service Introduction #Marketing Plan and Strategy #Diagram
-

Brand Growth Goals and Strategic Direction Diagram
#Business Strategy #Marketing Plan and Strategy #Diagram
-

Carbon Neutral Customer Analysis Pyramid Diagram
#Marketing Plan and Strategy #Diagram #Marketing Objectives
