US Target Market Analysis – Strategic Insights
RJ0300031_14
- Last Update 04/26/2025
- File Size 0.8MB
- # of Slides 2
- File Format PPTX
- Slide Ratio 16:9
- Color
Keywords
- #Content-Based Slides
- #Design-Based Slides
- #Market and Competitor Analysis
- #Marketing Plan and Strategy
- #Other
- #Target Market
- #Target Market Strategy
- #Map
- #16:9
- #US map PowerPoint slide
- #market analysis presentation template
- #target market geography slide
- #regional market analysis PPT
- #how to create US market analysis in PowerPoint
About the Product
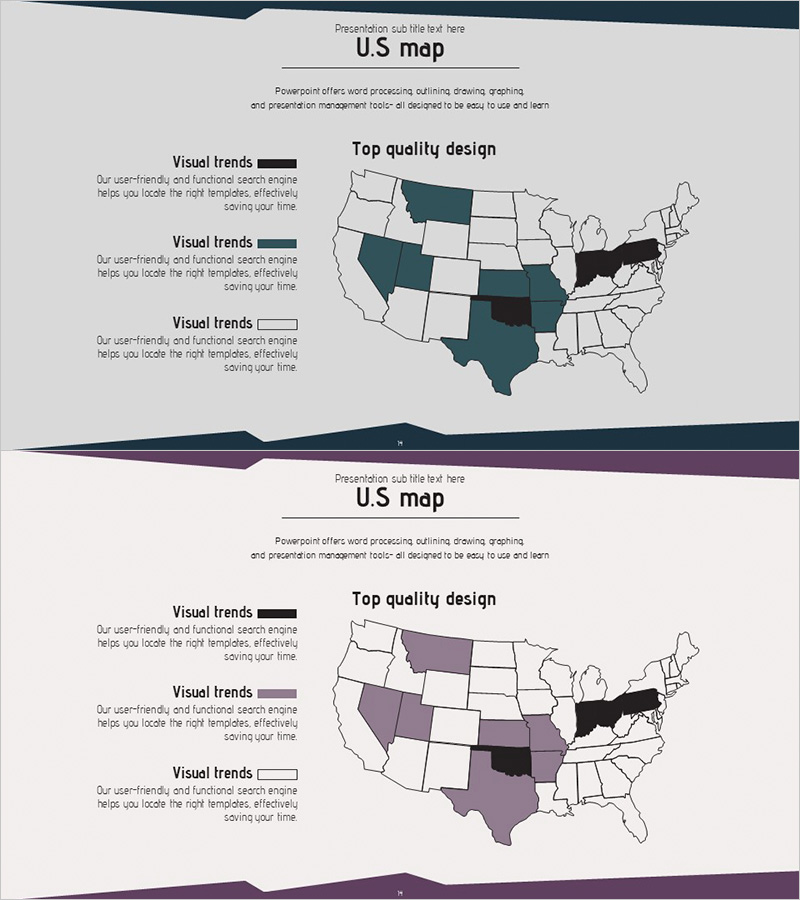
A 2-slide PowerPoint set for visualizing US target market analysis with geographic segmentation. Features three color schemes (dark blue, gray, and purple tones) with US maps highlighting five states for comparative analysis. Each slide includes three text input areas labeled 'Visual trends' on the left side, enabling simultaneous presentation of market insights, competitive analysis, and regional strategies. Fully editable in PowerPoint and optimized for marketing plans, market research reports, and investor presentations.
Usage Points
-
Main Usage
Visualizes US market segmentation by state and region to present target market analysis findings. Color-coded state highlighting enables intuitive representation of quantitative data such as market share, growth rates, and competitive intensity. Left-side text areas allow detailed documentation of regional strategies, opportunities, and risk factors for each geographic segment.
-
How to Use
Insert into the 'Market Overview' or 'Target Market Analysis' section of marketing plans, market research reports, or investor pitch decks. Customize map colors to match your data, then populate left text boxes with regional market size, growth projections, and market entry strategies. Use the two different color schemes to compare current state (As-Is) versus target state (To-Be) scenarios.
-
Recommended For
Marketing managers, business development teams, and executives presenting US market expansion strategies or regional business plans to investors. Particularly effective for B2B market entry strategy presentations, franchise or distribution network expansion plans, and regional marketing budget allocation discussions.
-
Slide Structure
Each slide contains a header area (title section), central US map with 5 highlighted states, and three left-side text boxes labeled 'Visual trends'. The map uses white background with black, dark blue, gray, and purple color coding. Each text box accommodates 3–4 lines of descriptive content. Bottom decorative lines enhance slide cohesion and visual consistency.
Related Products
-

Marketing Strategy Visualization with US Regional Target Map
#Market and Competitor Analysis #Marketing Plan and Strategy #Other
-

Effective Slide Design for Analysis of Specific Regions in the U.S.
#Market and Competitor Analysis #Marketing Plan and Strategy #Other
-

Map of Major Target Areas in the United States – Market Analysis and Marketing Strategy
#Market and Competitor Analysis #Marketing Plan and Strategy #Other
-

Note Illustration Theme US Map & Graph – Market Analysis and Strategy Introduction
#Market and Competitor Analysis #Marketing Plan and Strategy #Graph
