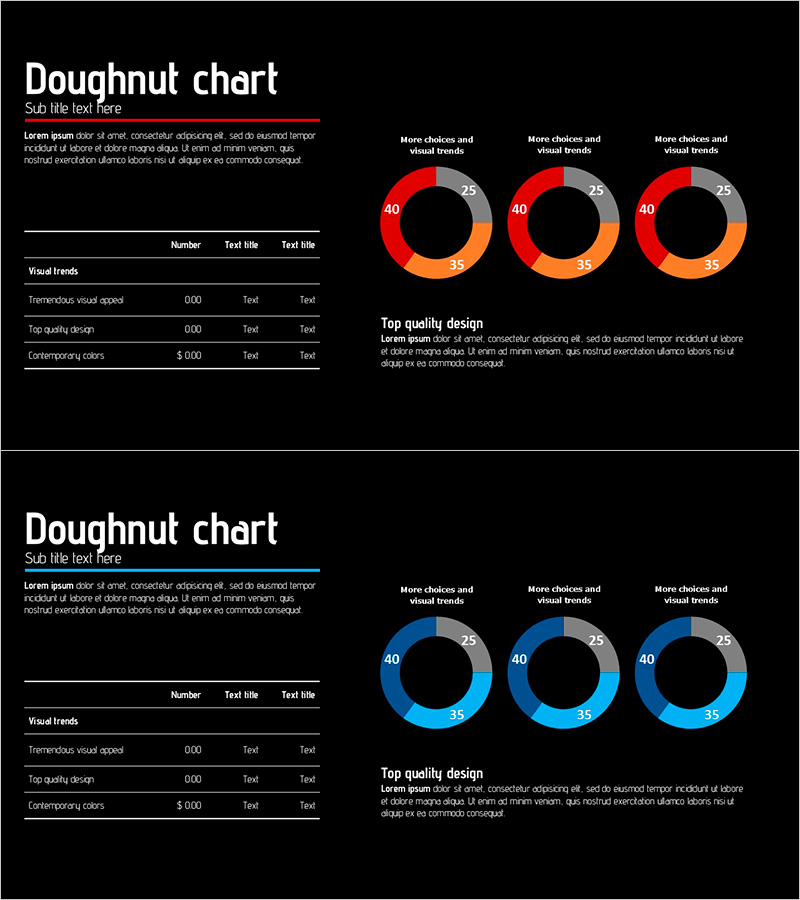
Market and Competitor Analysis
Visualizing Competitive Analysis with Table and 3 Donut Graphs
RJ0300027_16
- Last Update 12/21/2025
- File Size 0.5MB
- # of Slides 2
- File Format PPTX
- Slide Ratio 16:9
- Color
Keywords
About the Product
This slide effectively presents market and competitive analysis using three donut graphs and a table. Its modern and clear layout stands out visually, with a vibrant combination of red, blue, and orange colors. The table is structured for optimal data presentation, intuitively showcasing key insights of competitive analysis.
Related Products
-
Business Goal Setting Table – The First Step in Business Strategy Development
#Business Vision and Strategy #Financial Plans and Performance #Diagram
-
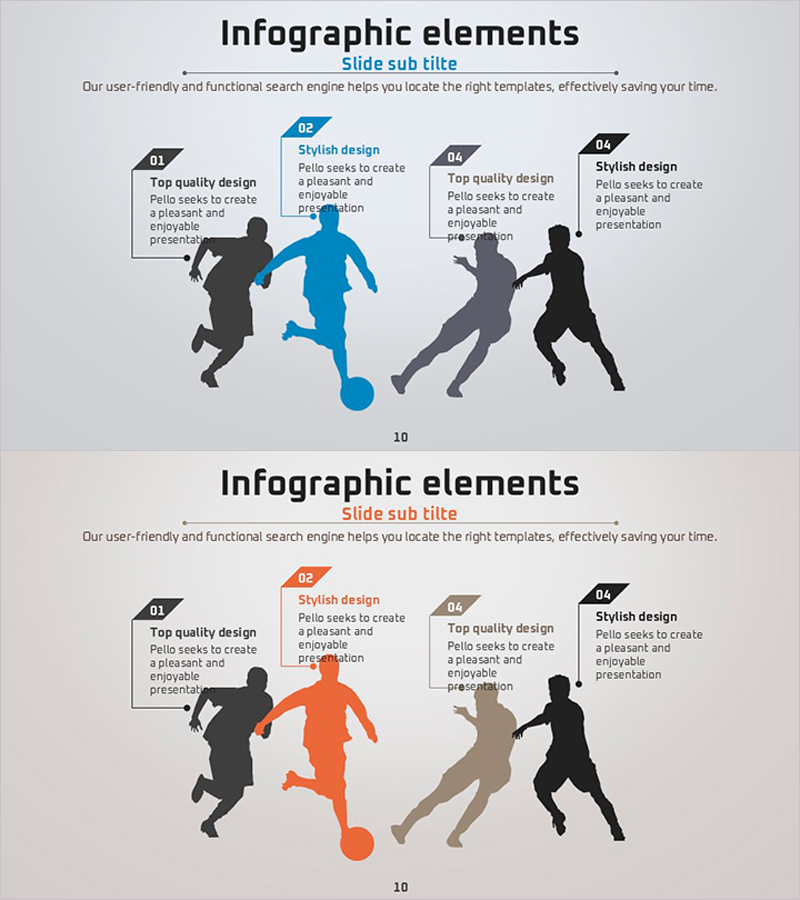
Silhouette and Analysis of Soccer Players – Understanding Market Competition
#Market and Competitor Analysis #Diagram #Other
-

Astronomy Research Core Areas Diagram – Vision and Strategy of the Business
#Company Introduction #Business Vision and Strategy #Diagram
-
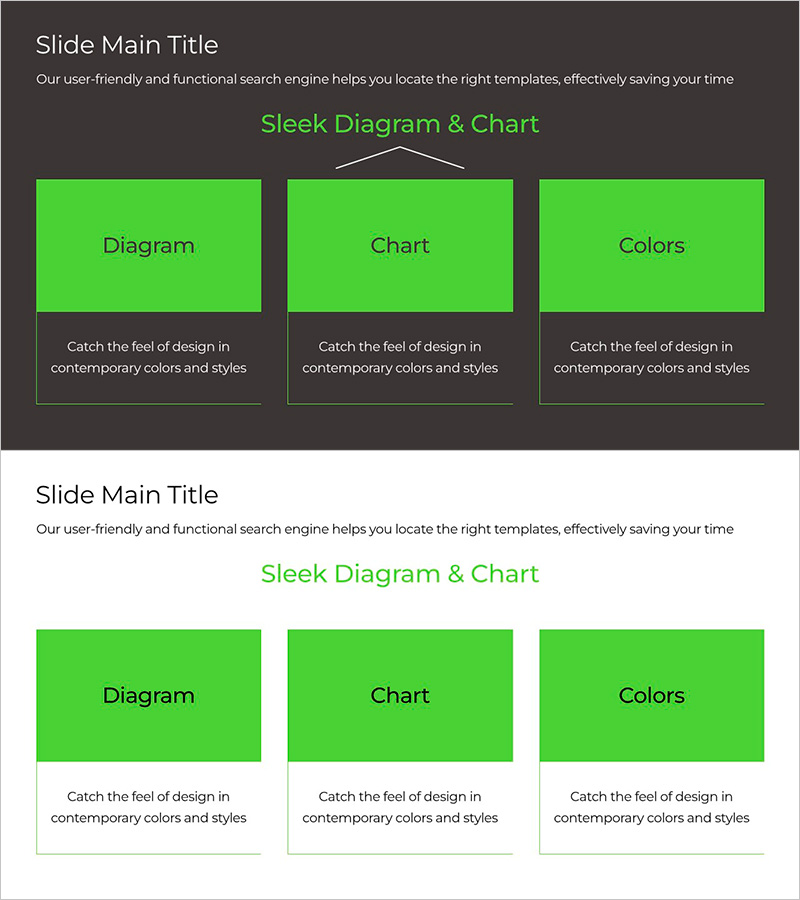
Green & Gray Template Wide Diagram – Vision and Core Values
#Company Introduction #Diagram #Core Values, Vision, and Mission
