Financial Plans and Performance
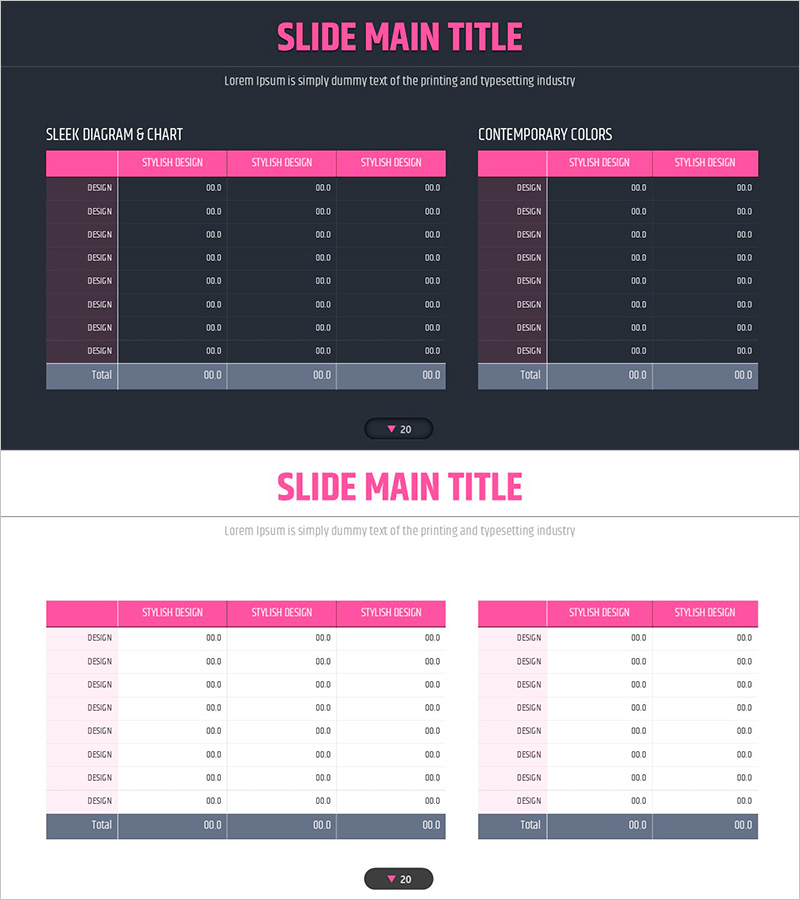
Four Color Infographic Presentation Table – Visualizing Financial Performance
RJ0200037_19
- Last Update 12/21/2025
- File Size 0.2MB
- # of Slides 2
- File Format PPTX
- Slide Ratio 16:9
- Color
Keywords
About the Product
This slide uses a four-color infographic style table to intuitively visualize financial performance. Its simple and clear data structure makes it ideal for financial reports such as balance sheets and cash flow statements. The design emphasizes a modern feel, and the bright color combinations help to easily distinguish information. It's particularly suitable for investor presentations or executive reports, leaving a strong impression. The text and data fields are easy to replace, rated 'easy' for editing, allowing for quick integration into various presentations.
Related Products
-
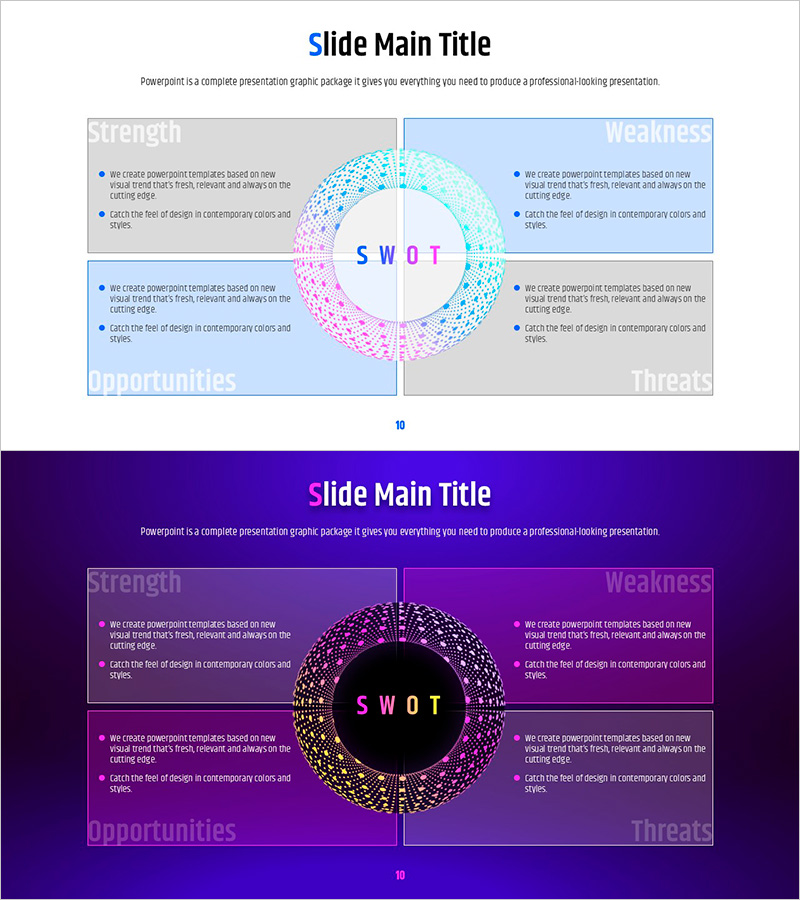
Geometric Pattern Wide PPT SWOT – Capture the Opportunities
#Market and Competitor Analysis #Diagram #SWOT Analysis
-

Program Introduction Illustration Diagram – Visualizing Business Goals
#Product/Service #Business Vision and Strategy #Diagram
-
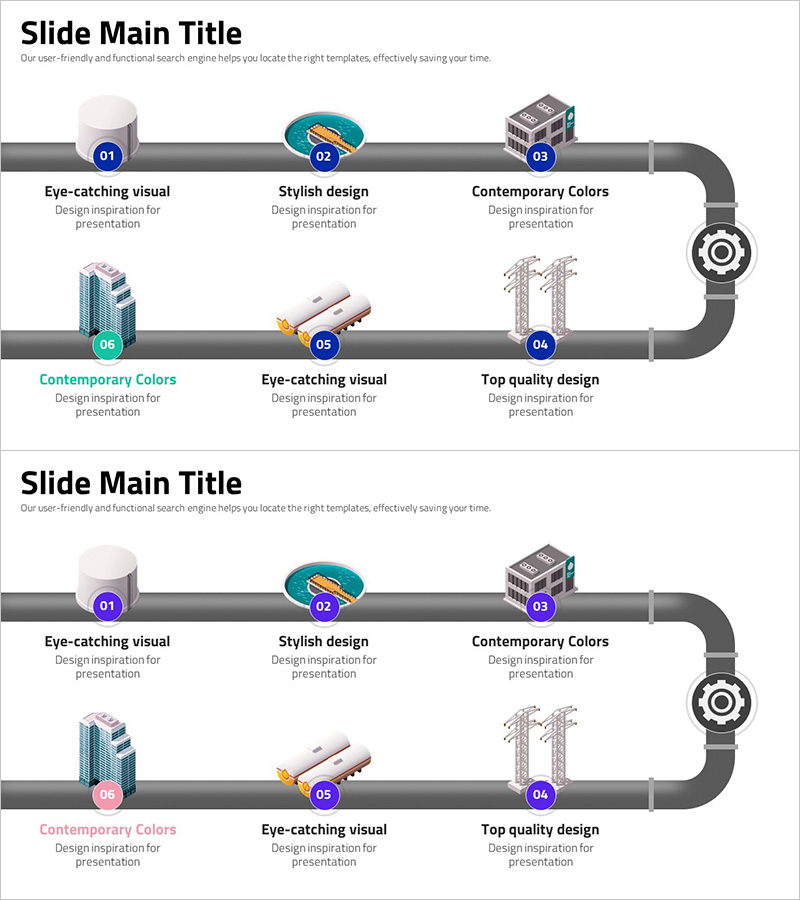
Eye-Catching Infographic Slide Design
#Business Promotion Strategy #Operation Plan #Diagram
-

Mountain Climbing Major Marketing Activities PPT Slide
#Product/Service #Marketing Plan and Strategy #Diagram
