Financial Plans and Performance
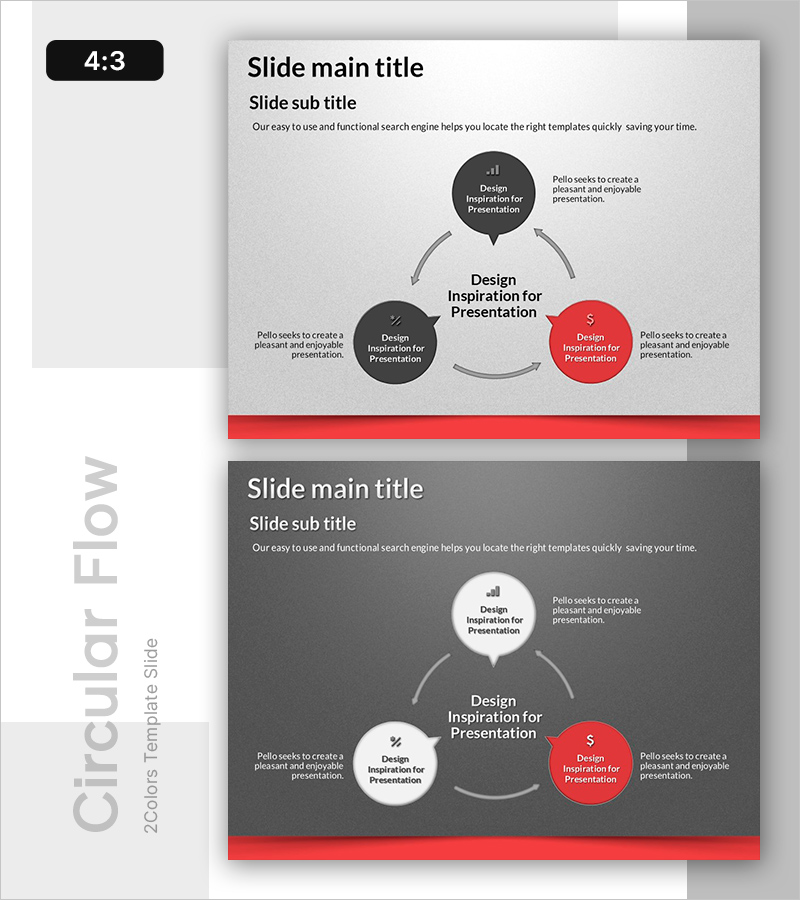
Financial Planning and Investment Strategy PPT Circular Diagram
RB0800041-1_4
- Last Update 12/21/2025
- File Size 2MB
- # of Slides 2
- File Format PPTX
- Slide Ratio 4:3
- Color
Keywords
- #Content-Based Slides
- #Design-Based Slides
- #Financial Plans and Performance
- #Diagram
- #Capital Requirement Plan
- #Tax Strategy and Benefits
- #Flow
- #Spread
- #Circular Flow
- #Centralized Diagram
- #4:3
- #Financial Planning
- #Investment Strategy
- #Circular Diagram
- #PowerPoint Template
- #Financial Plan
- #Funding Plan
- #Tax Strategy
About the Product
This slide features a circular diagram designed to effectively present financial planning and investment strategies. Its design is centered, allowing for intuitive communication of financial plans and funding analysis. The bold red color enhances visual recognition while emphasizing key information at each stage. Ideal for presentations focused on financial services or investment pitches, this slide offers easy editing with simple text and shape replacements, making it suitable for immediate use with an editing difficulty rated as 'easy'.
Related Products
-
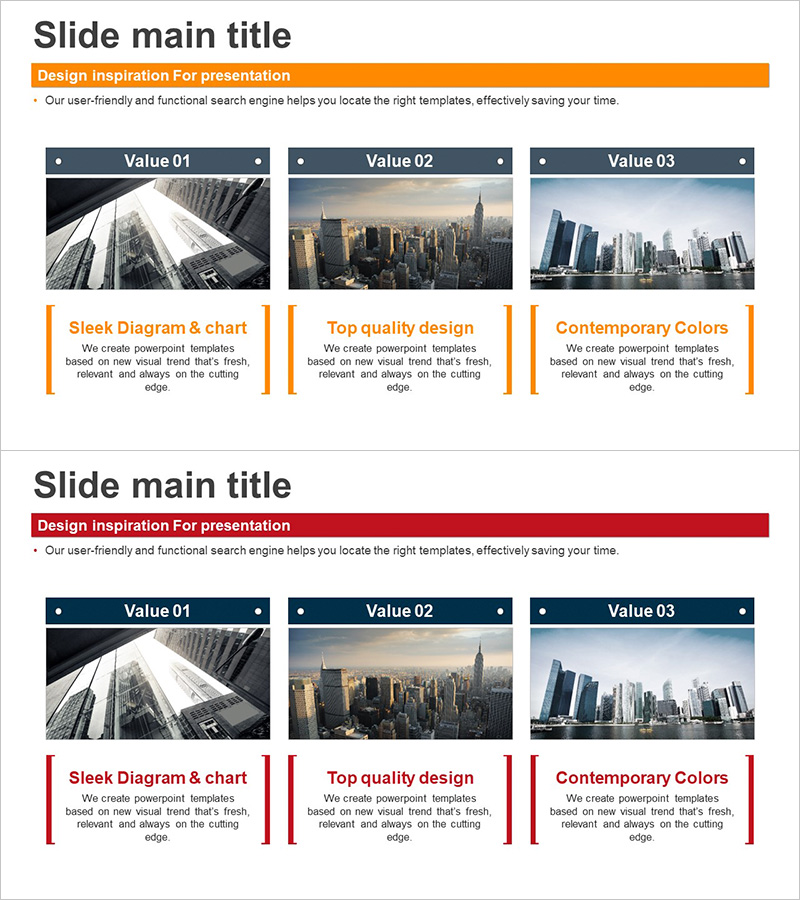
Goals Diagram for Business Success – Strategy and Vision
#Product/Service #Business Vision and Strategy #Diagram
-
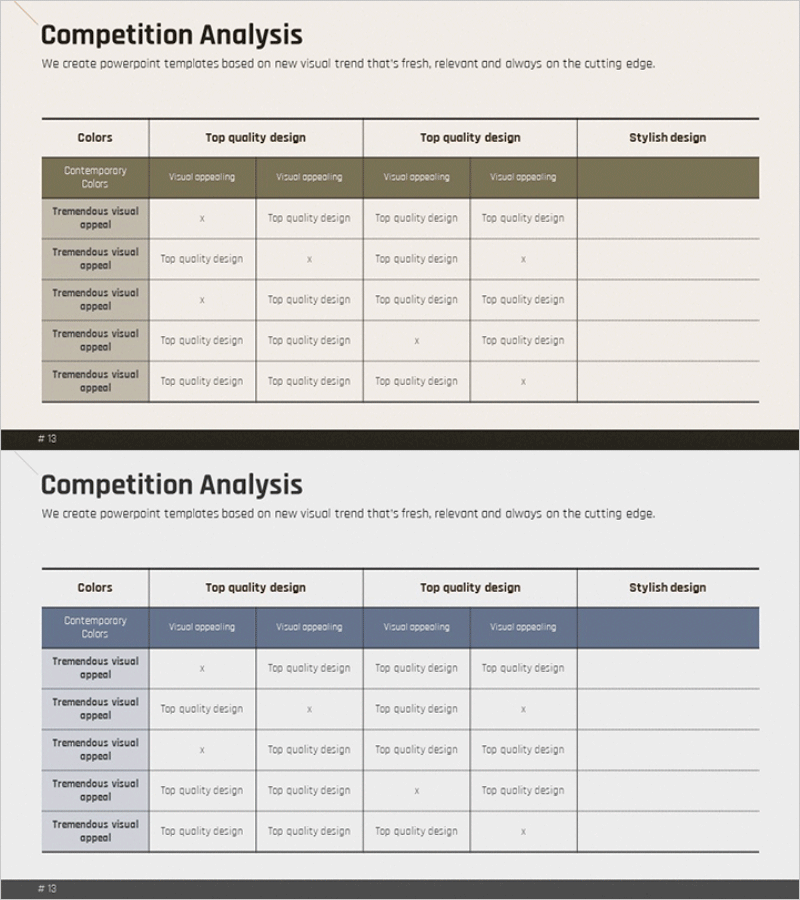
Competitive Comparison Analysis Table – Read the Market Situation
#Market and Competitor Analysis #Financial Plans and Performance #Diagram
-
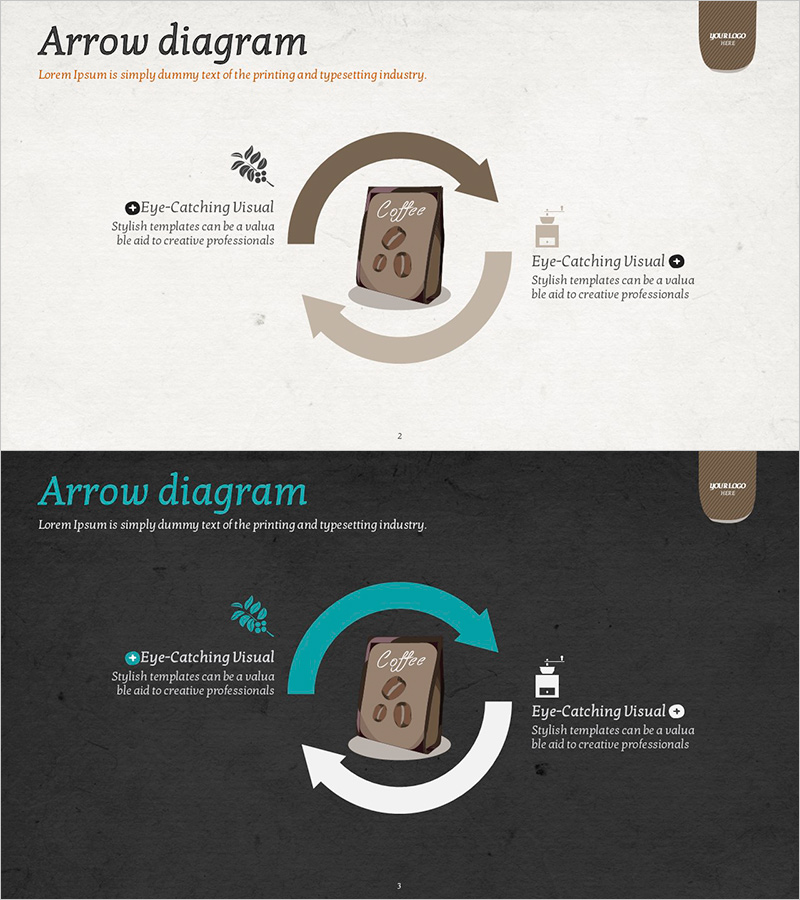
Diagram Using Coffee Beans for Visualizing Operations Strategy – Efficient Production Management
#Operation Plan #Diagram #Production and Technological Development Strategy
-
Animal Nature Business Strategy Flow – Vision Responding to Environmental Changes
#Business Vision and Strategy #Business Promotion Strategy #Diagram
