Diagram
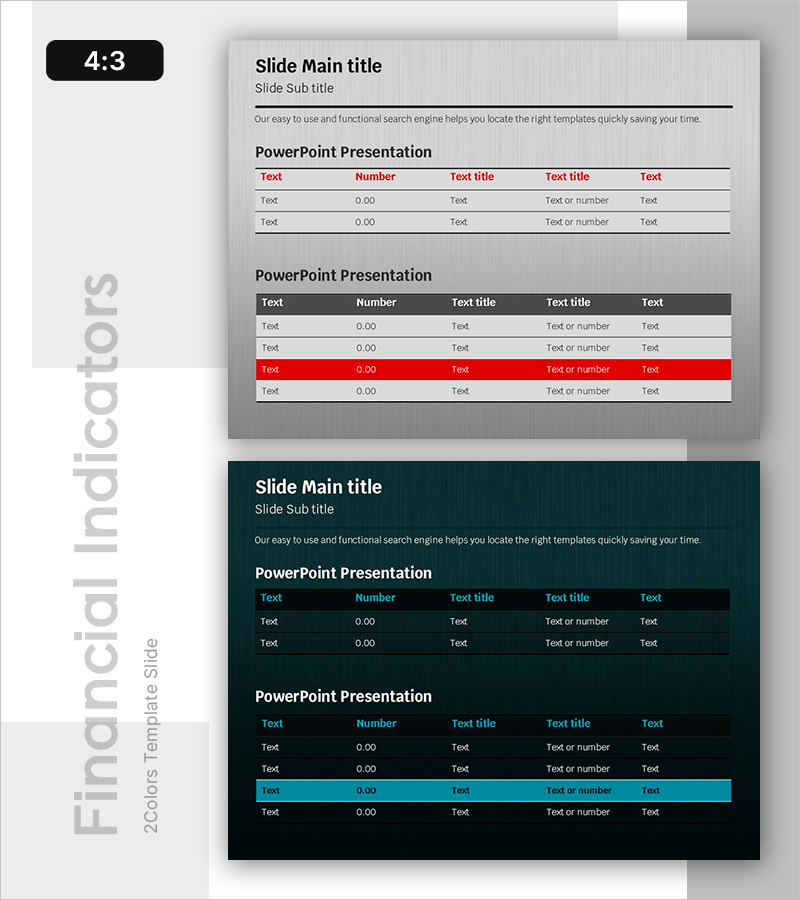
Financial Metrics at a Glance – Data Visualization Slide
RB0800026_13
- Last Update 12/21/2025
- File Size 1.1MB
- # of Slides 2
- File Format PPTX
- Slide Ratio 4:3
- Color
Keywords
About the Product
This presentation template features a data visualization slide designed to present financial metrics at a glance. With a smooth and intuitive layout, it is suitable for business presentations such as management analysis reports or investment proposals. The harmonious color scheme of red and turquoise attracts attention and leaves a strong impression on the audience. The table and chart can be easily replaced, and the user-friendly editing structure allows for quick addition of various data.
Related Products
-

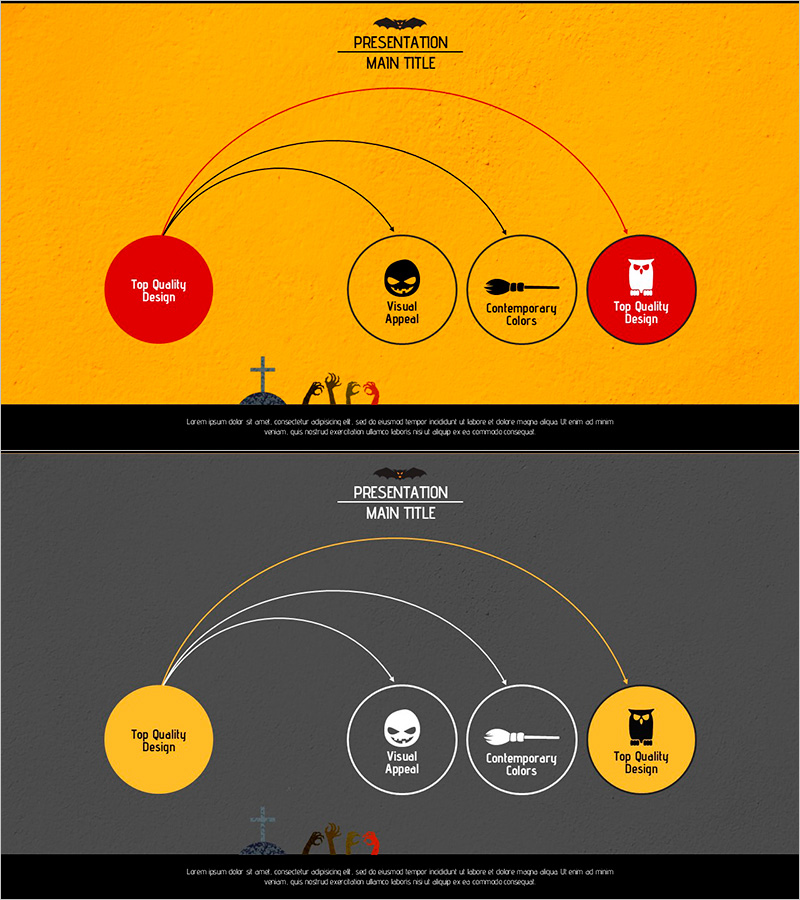
Communication Strategy Diagram – Cluster for Marketing Strategy
#Product/Service #Marketing Plan and Strategy #Diagram
-
Connection Diagram Stretching Out at a Point – Operational Planning and Risk Management
#Operation Plan #Technology Sector #Diagram
-
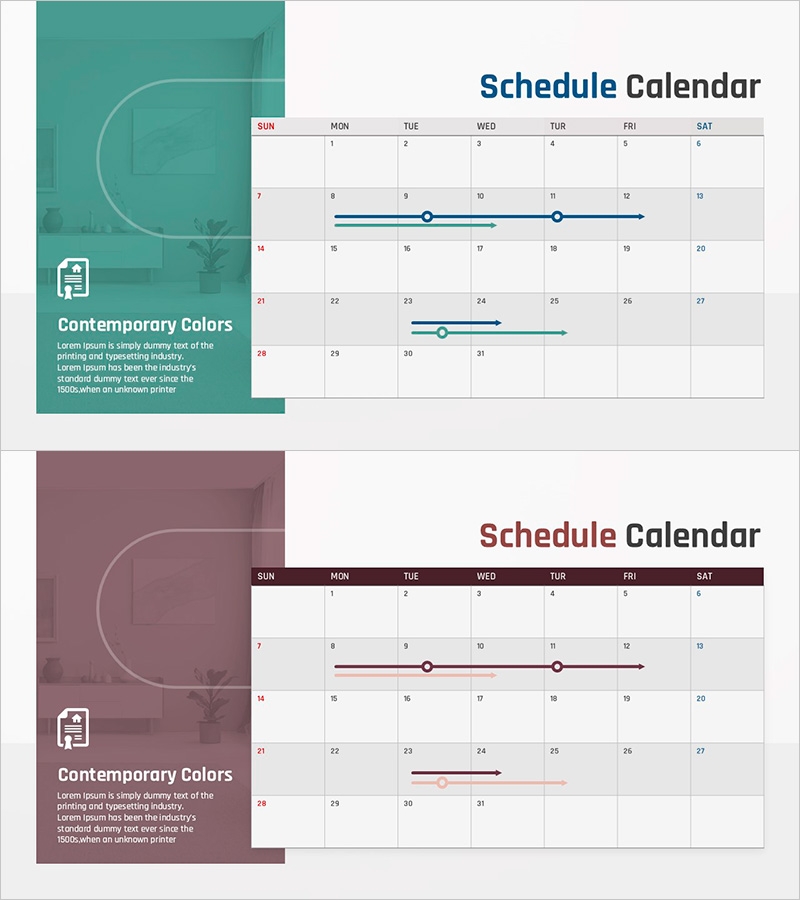
Construction Promotion Schedule – Efficient Management and Strategy
#Business Promotion Strategy #Business Management #Diagram
-
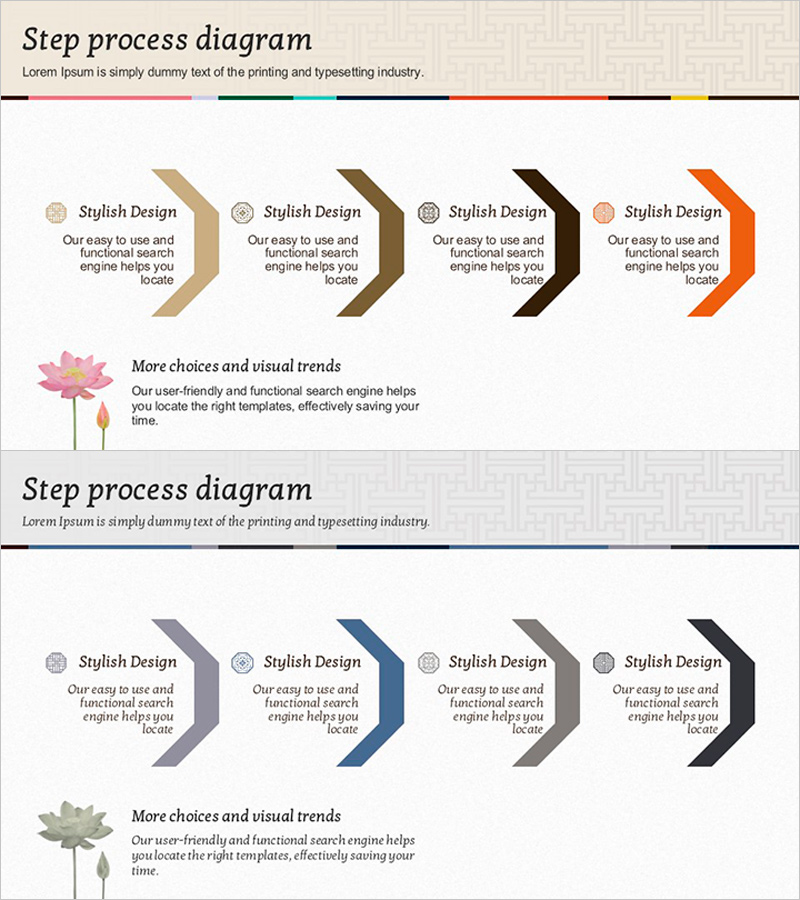
Flow Process Slide Visualized with Traditional Patterns
#Business Promotion Strategy #Technology Sector #Diagram
