Operation Plan
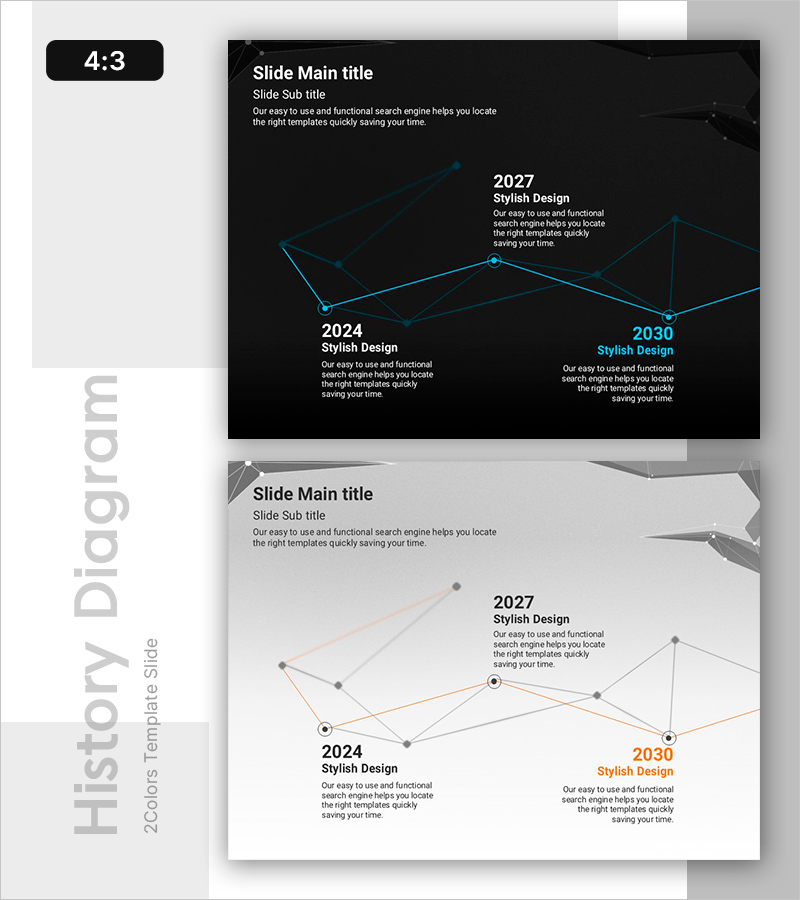
Line History Diagram: Optimized Design for Time Series Data Analysis
RB0800019_4
- Last Update 12/21/2025
- File Size 2.7MB
- # of Slides 2
- File Format PPTX
- Slide Ratio 4:3
- Color
Keywords
About the Product
This slide features a Line History Diagram designed to visually represent time series data by seamlessly connecting various data points across different years. The modern design with blue and orange highlights the flow of information effectively. It serves well in operational planning and technical fields, providing a solid foundation for data analysis. The slide is particularly suitable for business professionals and technical department staff, making it easy to integrate Excel data and graphs into presentations quickly. It offers full editing capabilities for various reports and presentations.
Related Products
-
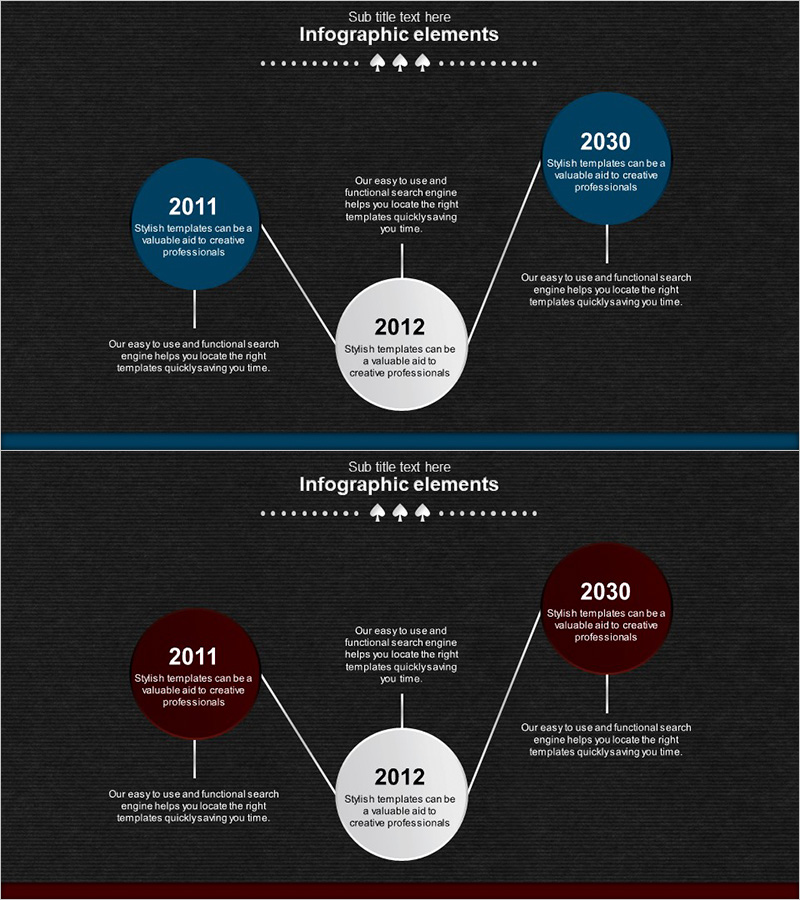
Spade Shape Theme History Diagram – Emphasizing Company Development
#Company Introduction #Diagram #History
-
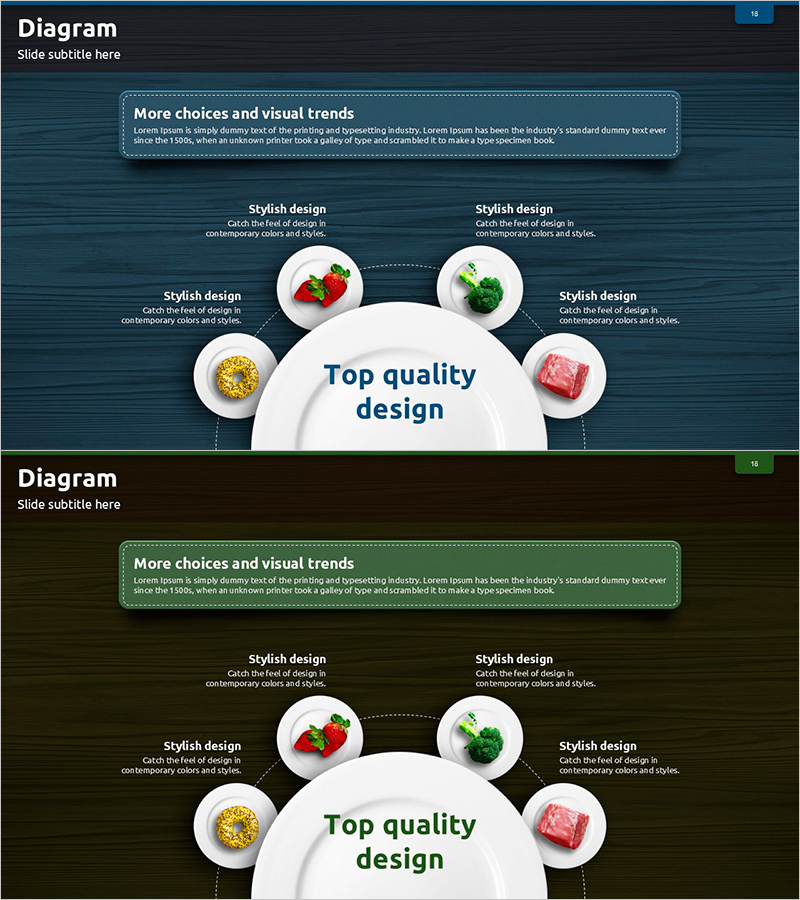
Food Nutrient Diagram – Capturing Nutrition and Quality
#Product/Service #Business Vision and Strategy #Diagram
-
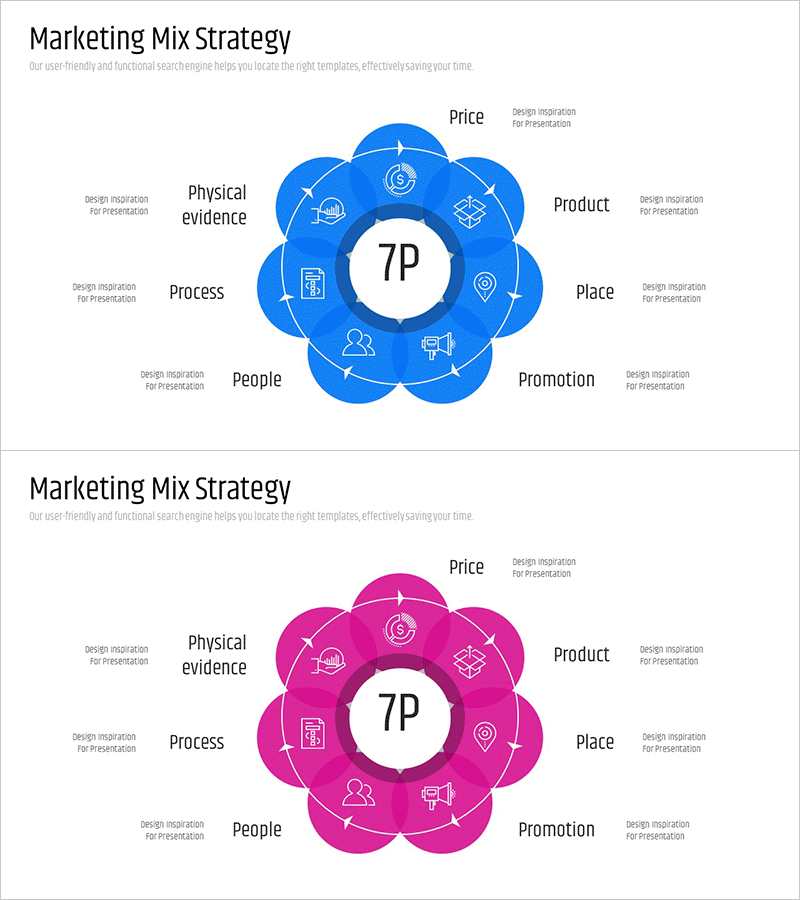
7P Marketing Overlay Diagram – Innovation in Business Strategy
#Business Vision and Strategy #Marketing Plan and Strategy #Diagram
-

Dot Patterns Wide Presentation Template – Cluster Diagram
#Product/Service #Diagram #Product/Service Introduction
