Market and Competitor Analysis
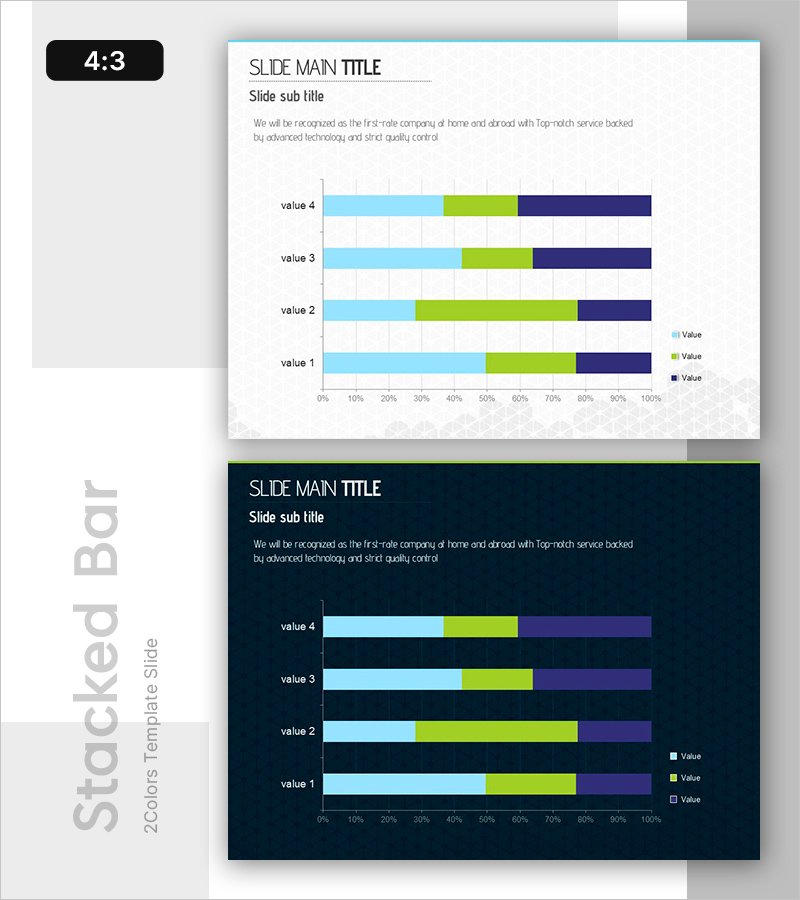
Market Trends Visualized with Stacked Graph – Sales Performance and Competitive Analysis
RB0800009_10
- Last Update 12/21/2025
- File Size 3.3MB
- # of Slides 2
- File Format PPTX
- Slide Ratio 4:3
- Color
Keywords
About the Product
This slide is designed as a stacked graph to effectively visualize market trends. Users can clearly understand sales performance and competitive analysis trends through a blend of purple, green, and blue data. The slide is optimized for a 4:3 ratio, making it suitable for business meetings, investment presentations, and reports. With a clear layout and distinctive color scheme, it leaves a strong visual impression. It has high editing ease, allowing quick replacement of text and data areas, and is immediately applicable to various presentations.
Related Products
-
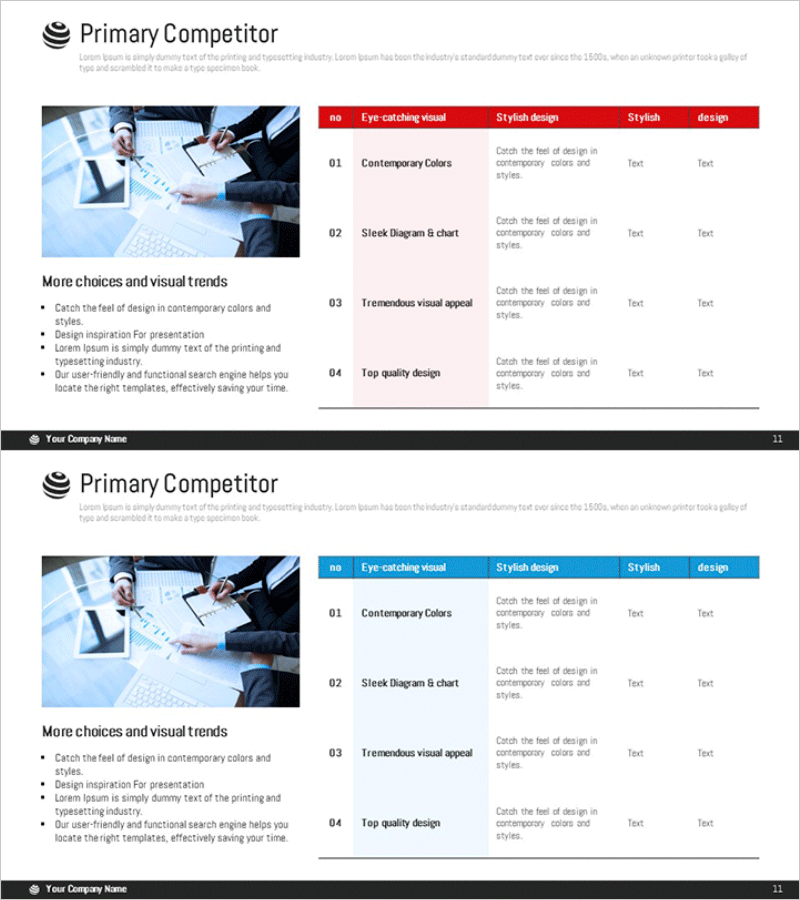
Competitor Analysis Table – Optimized for Market and Competitor Analysis
#Market and Competitor Analysis #Diagram #Competitor Analysis
-
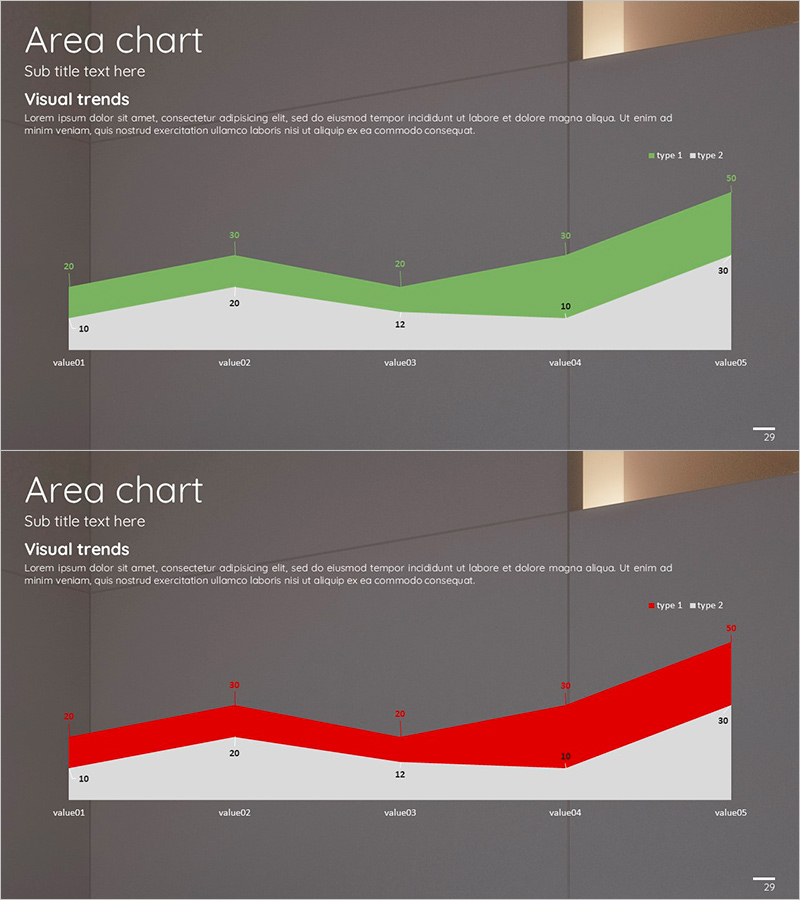
Interior Template Area Chart – Market Trends and Analysis
#Market and Competitor Analysis #Graph #Other
-
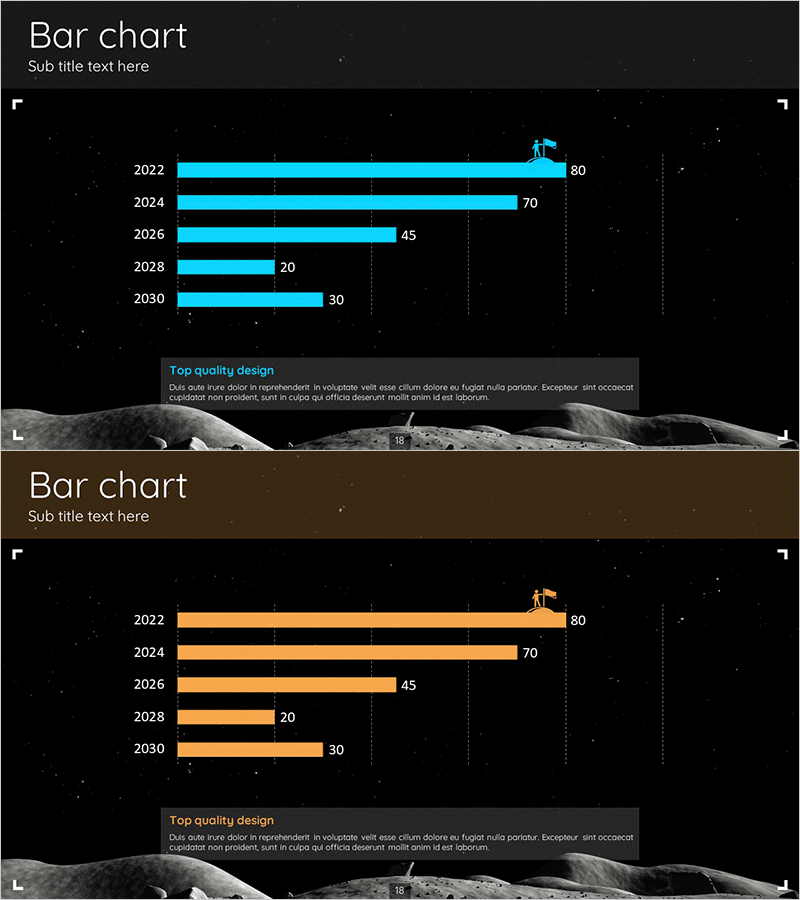
Space Exploration Theme Bar Graph – Ideal Visualization for Market Analysis
#Market and Competitor Analysis #Graph #Market Analysis
-
Interplanetary Competitive Advantage Diagram – Competitive Analysis in Space
#Market and Competitor Analysis #Diagram #Competitive Advantage
