Financial Plans and Performance
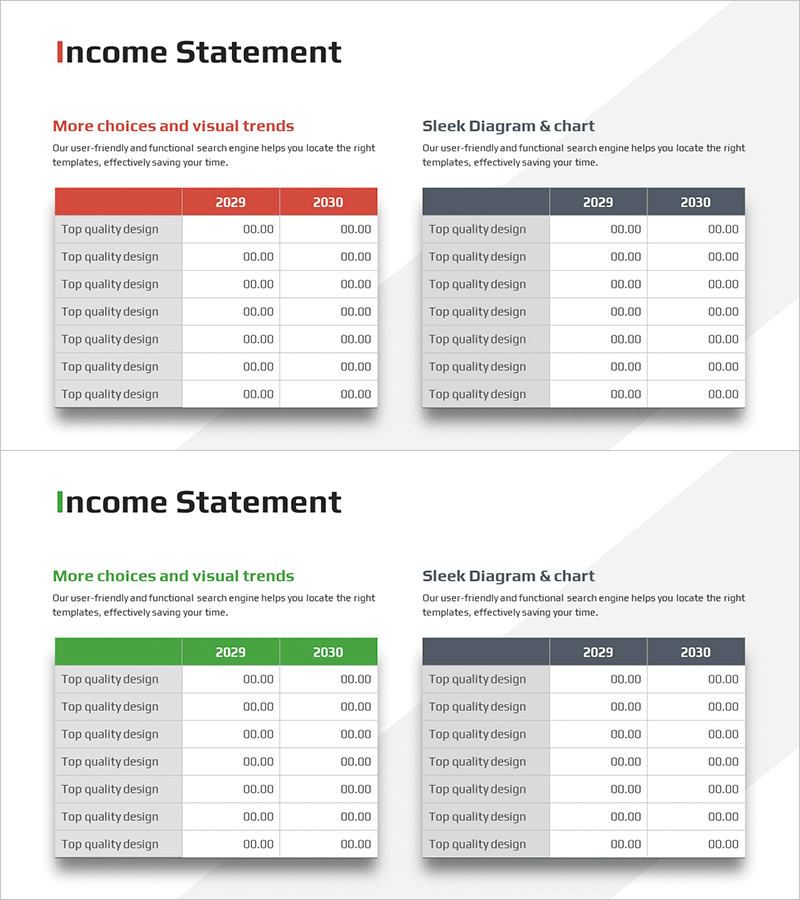
Profit and Loss Analysis Table Chart – Visualizing Financial Performance
RM0600005_25
- Last Update 12/21/2025
- File Size 0.3MB
- # of Slides 2
- File Format PPTX
- Slide Ratio 16:9
- Color
Keywords
About the Product
This slide offers a table chart designed for effective profit and loss analysis. It facilitates clear presentation of financial performance data for 2029 and 2030, making it perfect for executives and investors. The harmonious use of red and green colors emphasizes the significance of the information, while the modern design delivers a professional impression. Ideal for financial reports, planning documents, and decision-making resources, this slide ensures quick data accessibility with an overall editing difficulty rated as 'easy', allowing users to effortlessly replace text and figures.
Related Products
-
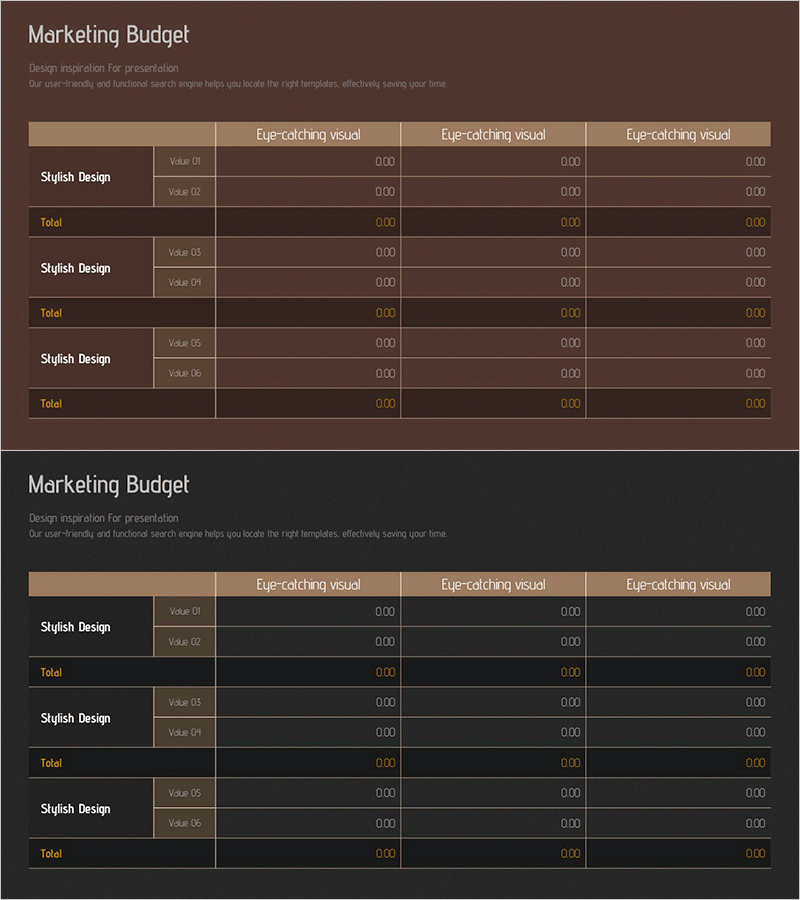
Advertising and Publicity Budget Summary Table
#Financial Plans and Performance #Diagram #Expected Rate of Return on Investment
-
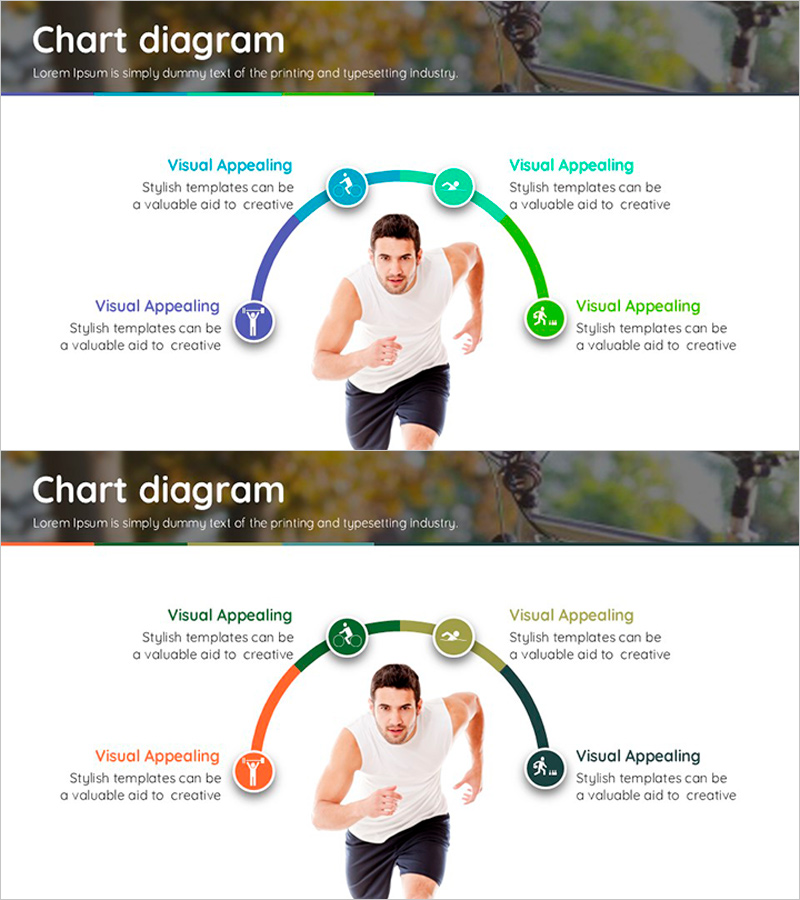
Extreme Sports Diagram - Business Vision and Strategy
#Product/Service #Business Vision and Strategy #Diagram
-
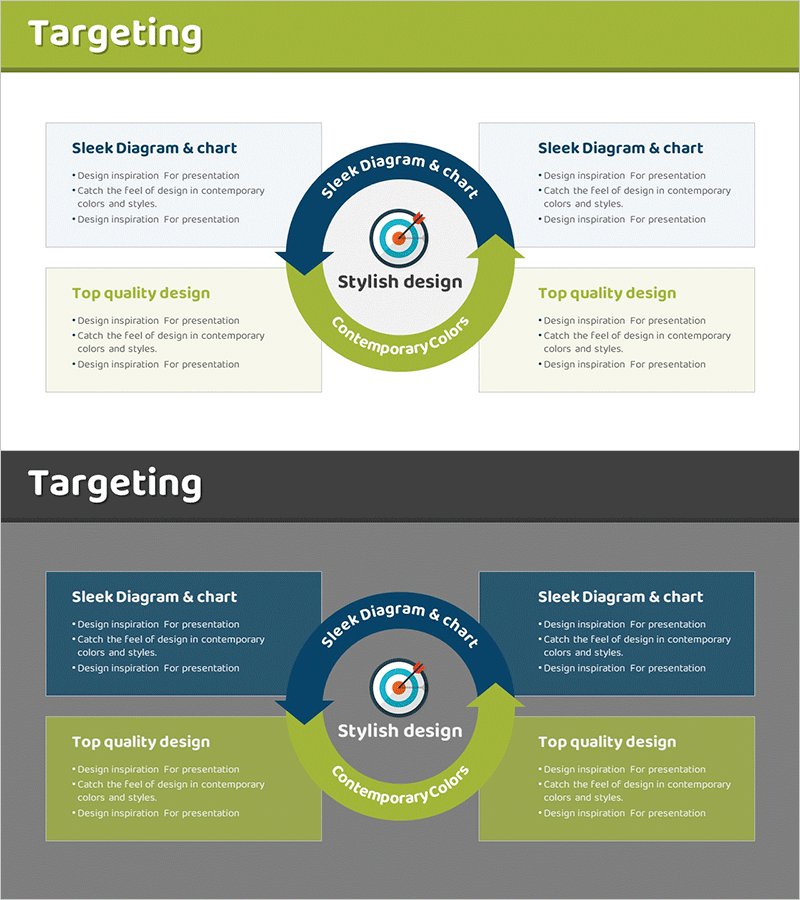
Circular Connection Diagram for Marketing Strategy Visualization – Effective Target Setting
#Product/Service #Marketing Plan and Strategy #Diagram
-

Diagram Slide for Automotive Safety Management System
#Business Management #Operation Plan #Diagram
