Financial Plans and Performance
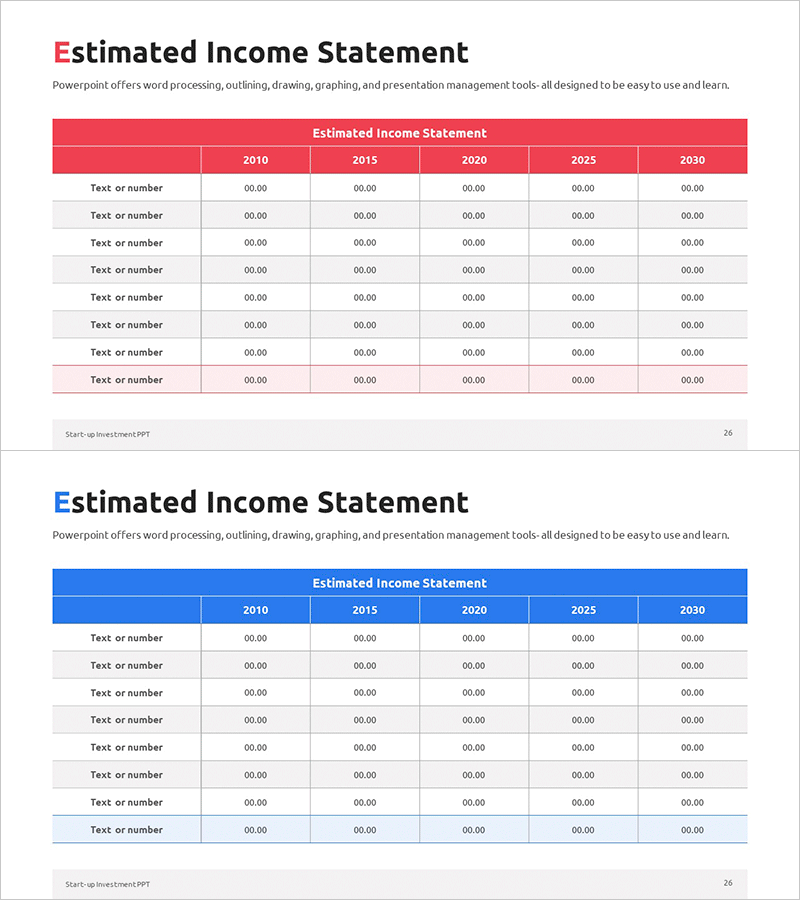
Year-by-Year Income Statement Chart – Financial Performance Analysis
RM0500010_25
- Last Update 12/21/2025
- File Size 0.5MB
- # of Slides 2
- File Format PPTX
- Slide Ratio 16:9
- Color
Keywords
About the Product
This slide presents a visually organized year-by-year income statement chart. Optimized for revenue and profit analysis, the template features a striking contrast of red and blue colors that emphasizes key data. The title 'Estimated Income Statement' prominently highlights the content, enhancing focus. It is mainly suitable for financial planning and performance presentations, effectively conveying complex data in a concise manner. Text and data within the slide are easily replaceable, rated as 'easy' in editing difficulty, allowing for quick integration into various presentation materials.
Related Products
-
Marketing Goals and Plans Slide Template - Business Strategy Steps
#Business Promotion Strategy #Business Management #Diagram
-
Blue Gradient Itinerary – Efficient Business Management
#Business Management #Operation Plan #Diagram
-
Key Strategic Elements for Network Growth – Innovation and Expansion
#Business Vision and Strategy #Diagram #Core Competencies
-
Target Setting Diagram – Market and Competitor Analysis
#Market and Competitor Analysis #Marketing Plan and Strategy #Diagram
