Business Introduction
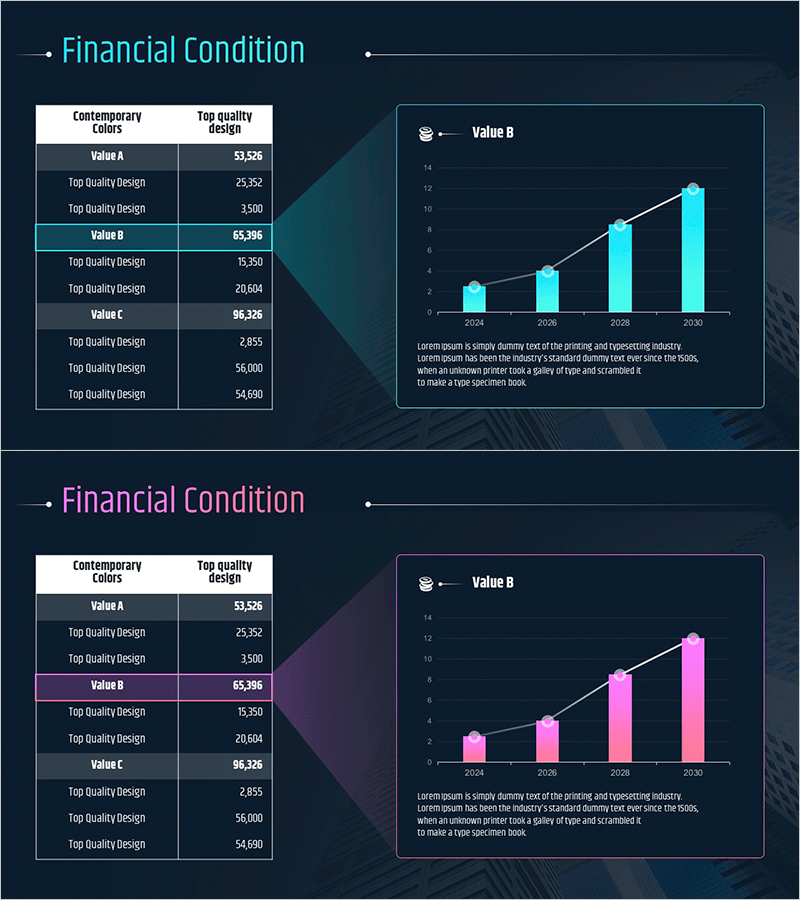
Revenue Growth Analysis Graph & Table - Financial Condition and Data Visualization
RM0500007_7
- Last Update 12/21/2025
- File Size 2.3MB
- # of Slides 2
- File Format PPTX
- Slide Ratio 16:9
- Color
Keywords
About the Product
This slide provides a revenue growth analysis graph and table that is useful for visually analyzing financial conditions. The graph is composed of blue, purple, and navy colors, designed for clear data comparison. It displays the revenue growth trend from 2024 to 2030, focusing on assessing the company's financial strategies and performance. Users can effectively convey concise and clear data analysis using this slide.
Related Products
-

Dot Patterns Wide PowerPoint Template Image&Text 1
#Business Introduction #Understanding the Business
-

Diagram Slide Explaining Structure and Function of Plants
#Product/Service #Diagram #Product/Service Introduction
-
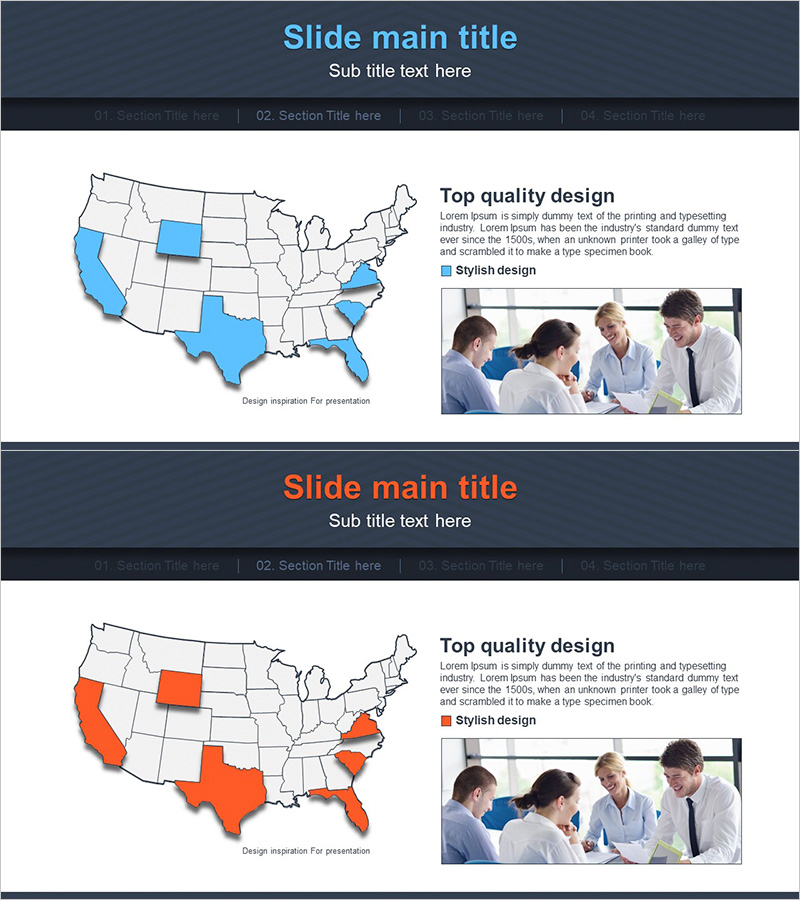
Analysis of Key Target Markets in the United States – Developing Effective Marketing Strategies
#Market and Competitor Analysis #Marketing Plan and Strategy #Other
-

Marketing Market Analysis Diagram – Strategic Insights
#Marketing Plan and Strategy #Diagram #Marketing Strategy
