Market and Competitor Analysis
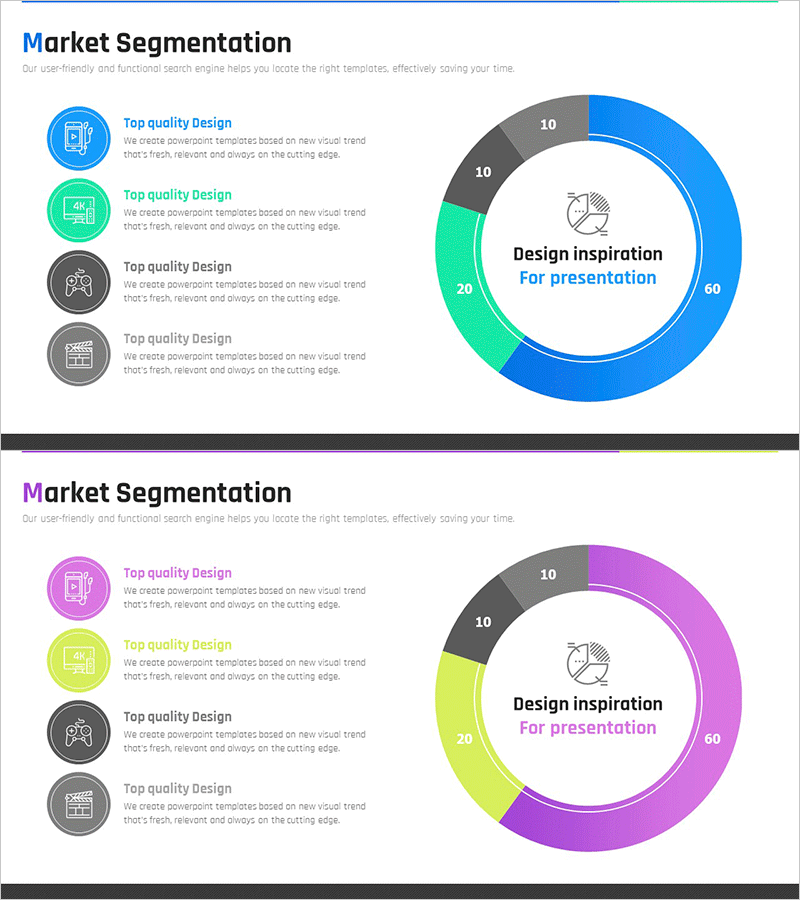
Market Share Change Visualized in Donut Chart
RM0400012_7
- Last Update 12/21/2025
- File Size 1MB
- # of Slides 2
- File Format PPTX
- Slide Ratio 16:9
- Color
Keywords
About the Product
This slide intuitively visualizes market share changes using a donut chart. The harmonious blend of blue and purple colors helps distinctly separate the data segments. It is ideal for analyzing various market data and serves as a good basis for presenting other related information. Particularly effective for presentations regarding market analysis and competitor analysis. The structure allows for easy text and data replacement with an editing difficulty rated as 'easy', suitable for various scenarios.
Related Products
-
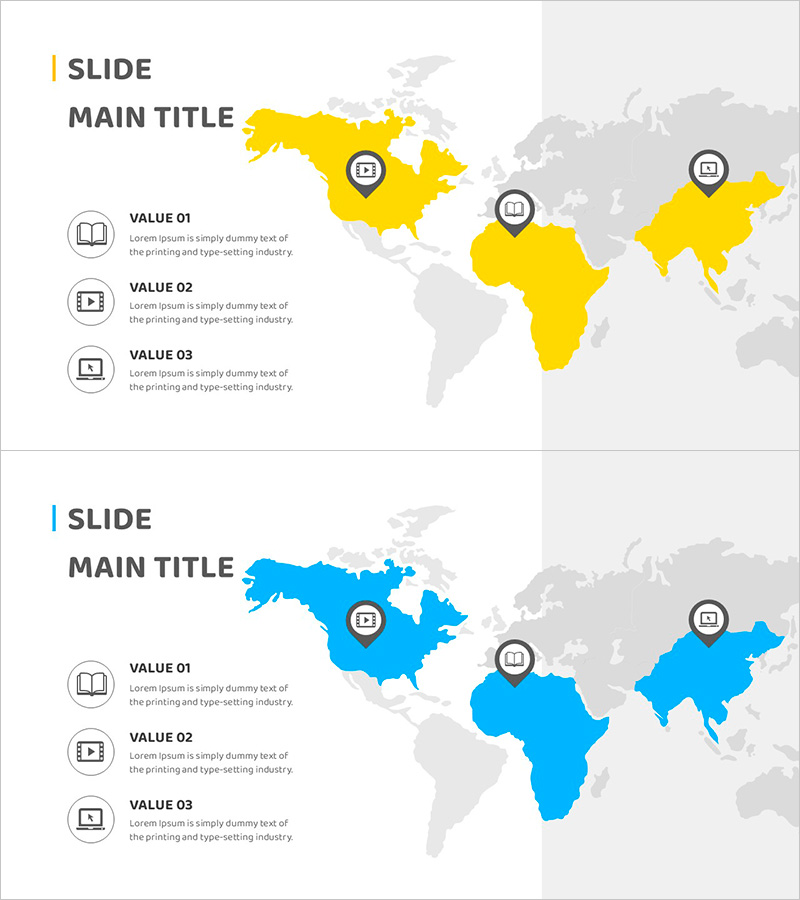
Slide Visualizing Learning Analysis by Country
#Company Introduction #Market and Competitor Analysis #Other
-

Introducing the Financial Education Expert – A Practical Presentation
#Company Introduction #Diagram #Introduction of Executives
-
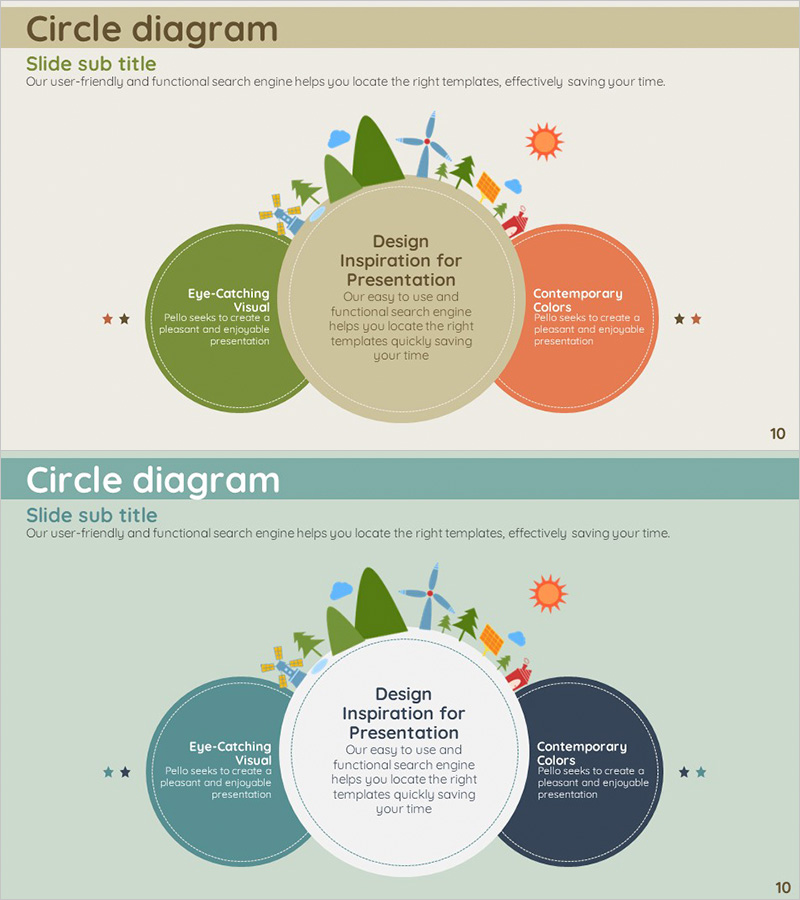
Business Goal Diagram for Energy Saving
#Business Vision and Strategy #Diagram #Business Strategy
-
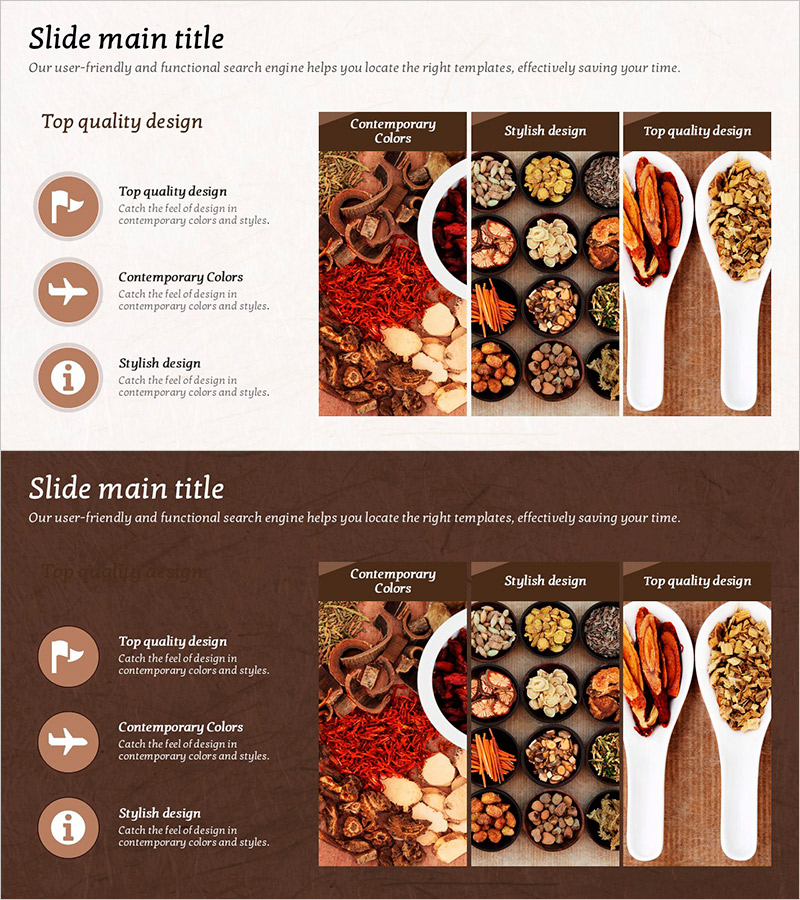
Oriental Pharmaceutical Materials Marketing Plan – Strategic Approach
#Marketing Plan and Strategy #Diagram #Marketing Objectives
