Business Introduction
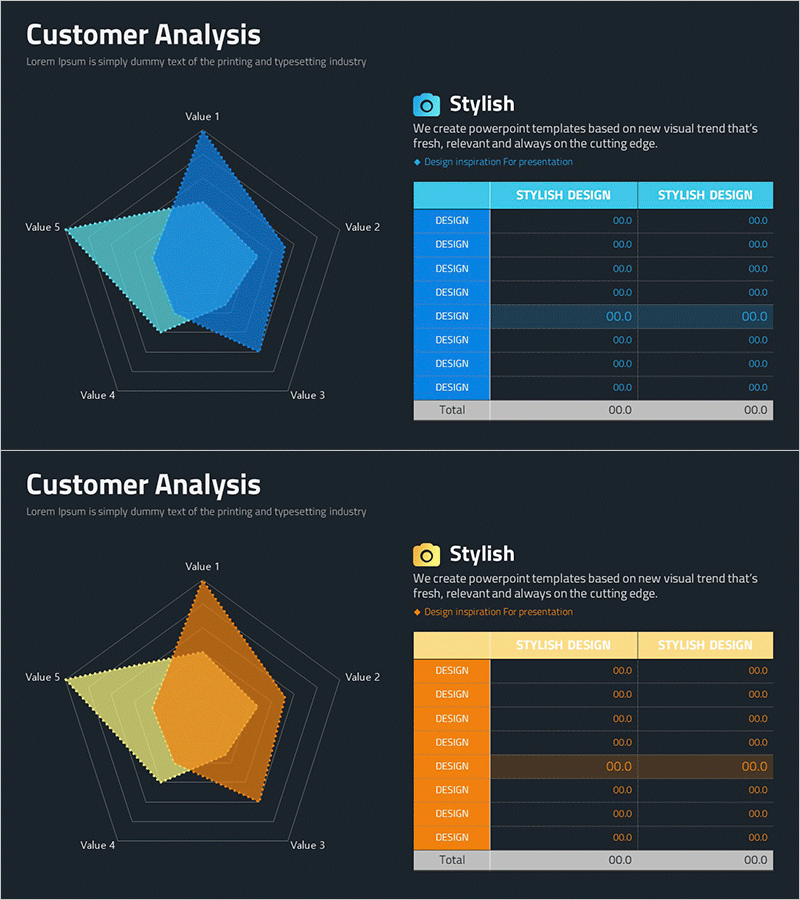
Pentagon Radial Graph & Table – Visualizing Customer Analysis
RM0200014_15
- Last Update 12/21/2025
- File Size 0.3MB
- # of Slides 2
- File Format PPTX
- Slide Ratio 16:9
- Color
Keywords
- #Content-Based Slides
- #Design-Based Slides
- #Business Introduction
- #Market and Competitor Analysis
- #Diagram
- #Graph
- #Technological Status
- #Customer Analysis
- #Table
- #Other
- #Radar Chart Spider Chart
- #16:9
- #Pentagon Radial Graph
- #Customer Analysis
- #Table
- #Market Analysis
- #Stylish
- #Data Visualization
- #Presentation
About the Product
This slide features a Pentagon Radial Graph and Table designed to visually represent customer analysis data. It is structured according to the latest visual trends, aiding clear communication of information, making it suitable for market analysis and business presentations. The contrast of blue and yellow enhances the professionalism and appeal of the presentation. It allows for easy editing to tailor information to user specifications and is designed to be versatile for various presentation settings.
Related Products
-
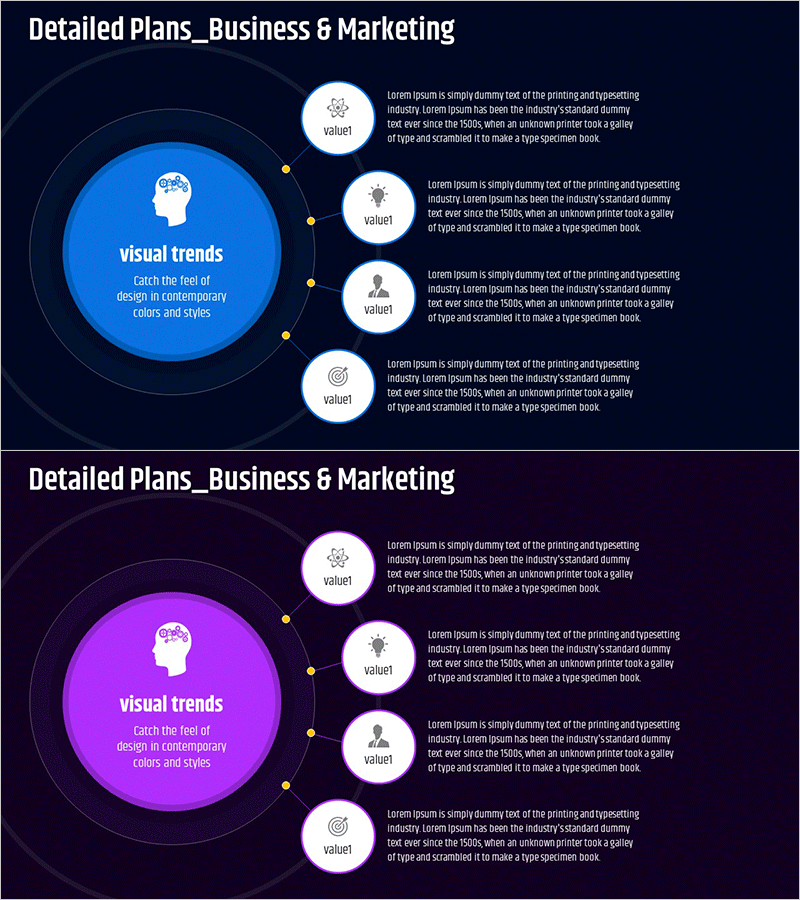
Core Business Goals Diffusion Diagram - Visual Representation of Business Strategy
#Business Introduction #Marketing Plan and Strategy #Diagram
-

Rainbow Paper Presentation Template Infographic Elements4 – Suitable for Market and Competitive Analysis
#Market and Competitor Analysis #Diagram #SWOT Analysis
-
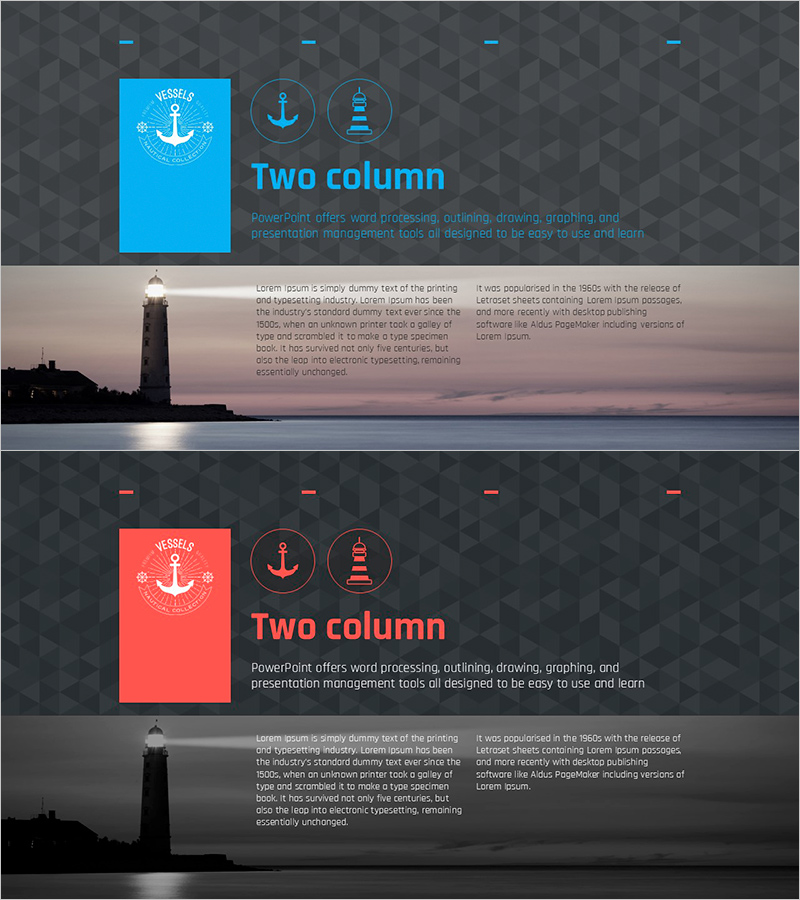
Nautical Lighthouse Background Text Page – Business Introduction and Case Study
#Slide Type #Business Introduction #Understanding the Business
-
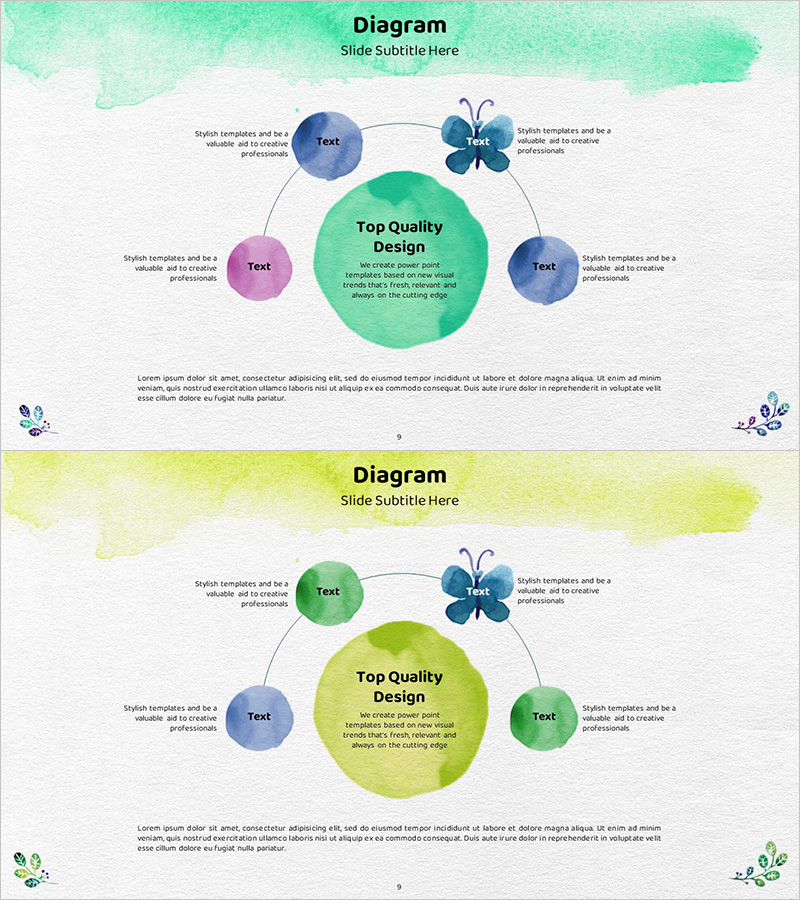
Watercolor Butterfly Diagram Business Process – A Guide for Flexible Business Structuring
#Product/Service #Technology Sector #Diagram
