Business Promotion Strategy
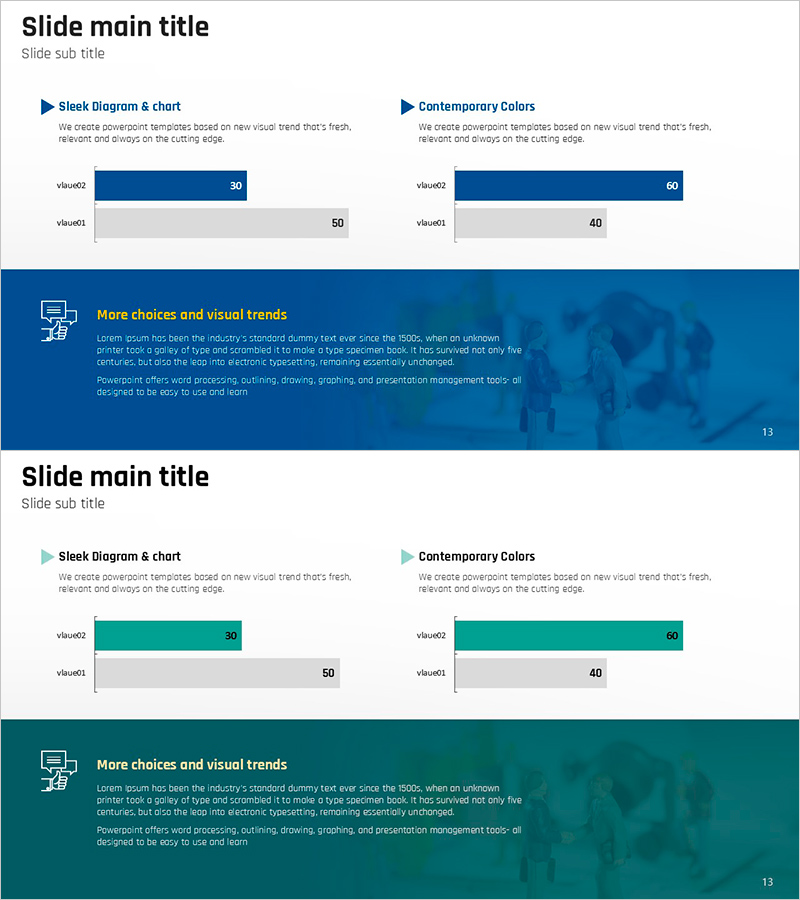
Business Performance Bar Graph – Strategy and Revenue Forecast
RJ0900008_12
- Last Update 12/21/2025
- File Size 0.9MB
- # of Slides 2
- File Format PPTX
- Slide Ratio 16:9
- Color
Keywords
About the Product
This slide features a horizontal bar graph that clearly showcases business performance. With a modern and sleek design, it is suitable for various business environments. The slide is composed of blue and green, effectively highlighting data comparisons to visualize achievements. It's particularly apt for explaining business strategies and revenue forecasts, leaving a positive impression on investors. The text and data fields are easily replaceable, allowing quick integration into various materials. Editing difficulty is rated as 'moderate'.
Related Products
-
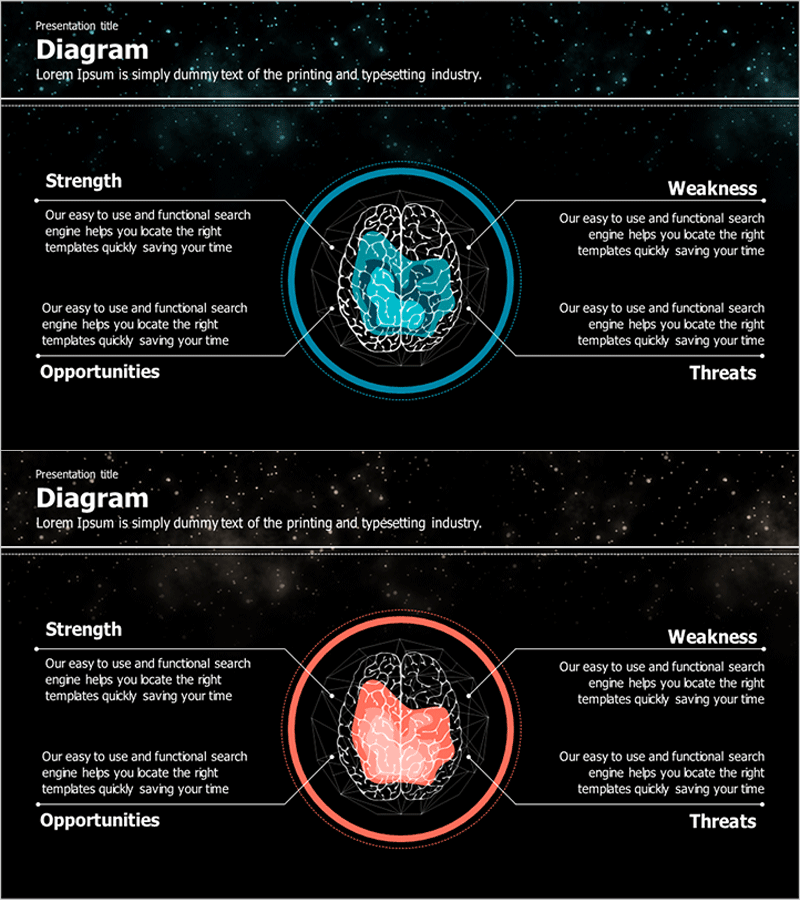
Brain Structure Shape SWOT Analysis Diagram
#Product/Service #Market and Competitor Analysis #Diagram
-
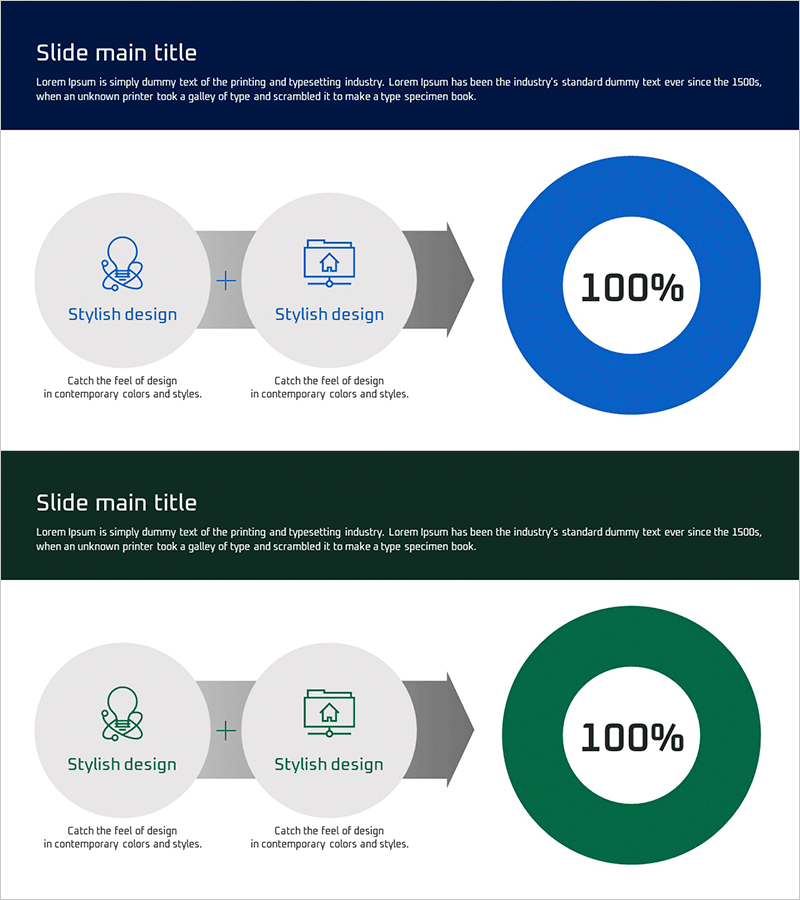
Linear Diagram Slide for Business Service Differentiation Strategy
#Product/Service #Diagram #Graph
-

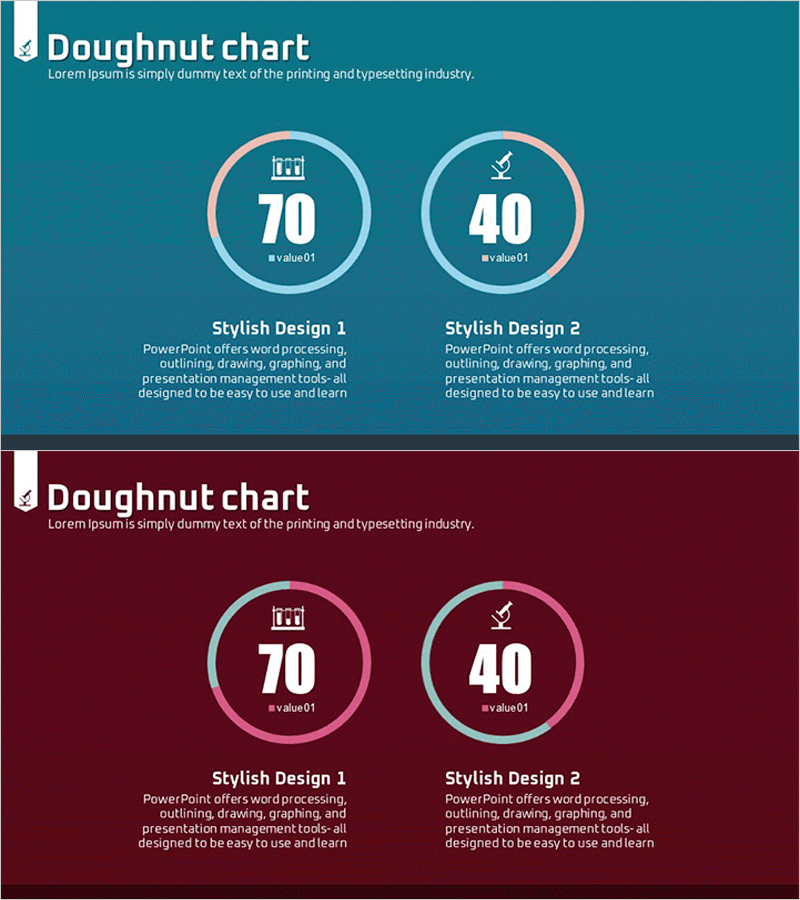
Financial Business Analysis Pie Chart – Market Share Insights
#Product/Service #Market and Competitor Analysis #Graph
-
Weather Progress Analysis Graph – Market Share and Development Status
#Product/Service #Market and Competitor Analysis #Graph
