
Company Introduction
Cycle Diagram to Visualize Chemistry Concepts
RJ0700021_29
- Last Update 12/21/2025
- File Size 0.9MB
- # of Slides 2
- File Format PPTX
- Slide Ratio 16:9
- Color
Keywords
About the Product
This slide presents various chemistry concepts using a cycle diagram, effectively conveying information in a clear and intuitive way. The scientific symbols visually enhance the experimental process in a circular format, promoting better understanding. Each element emphasizes key stages or values of the experiment, making it suitable for educational presentations, seminars, or research discussions. Additionally, users can easily replace text and images, with an overall editing difficulty rated as 'easy'. This slide serves as a powerful tool in fields requiring scientific structure and information dissemination.
Related Products
-

Collaborative Business Process – Visualized by Cluster
#Product/Service #Diagram #Program Introduction
-

Representative & Business Introduction Slide – Capturing Trust and Vision
#Company Introduction #Business Introduction #Business Vision and Strategy
-
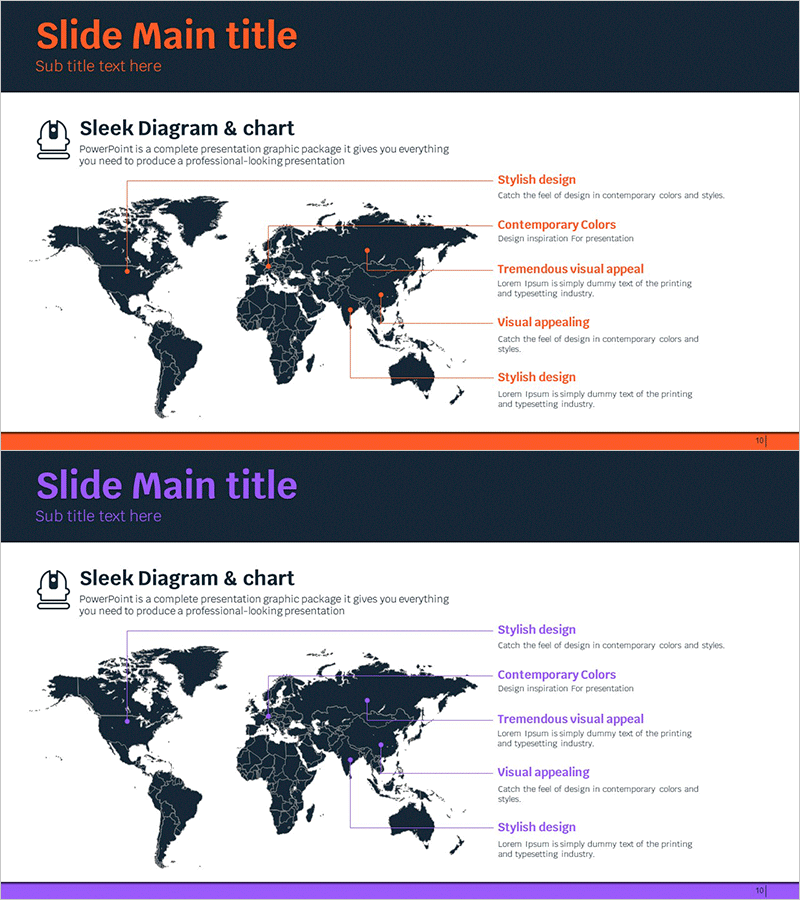
World Map with Detailed Country Analysis – Global Network and Market Strategy
#Company Introduction #Other #Global Network
-
Work and Service Execution Process Diagram
#Operation Plan #Technology Sector #Diagram
