Emotional Messages
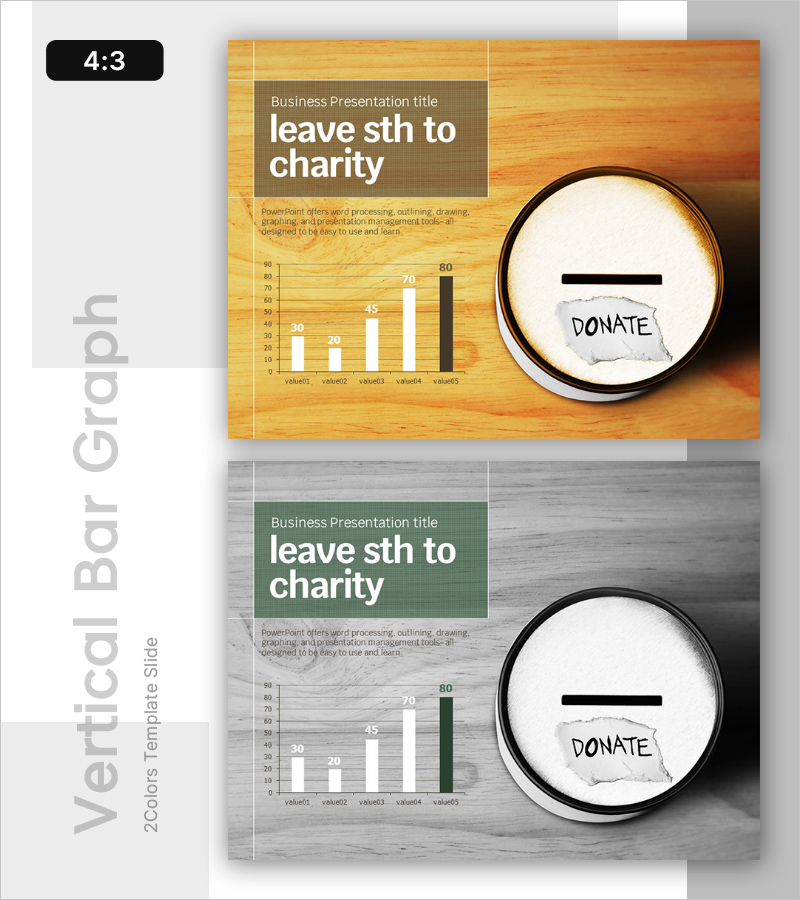
Distribution Graph by Donation Usage Items – Visualizing Charity and Hope
RL0100054_3
- Last Update 12/21/2025
- File Size 3.3MB
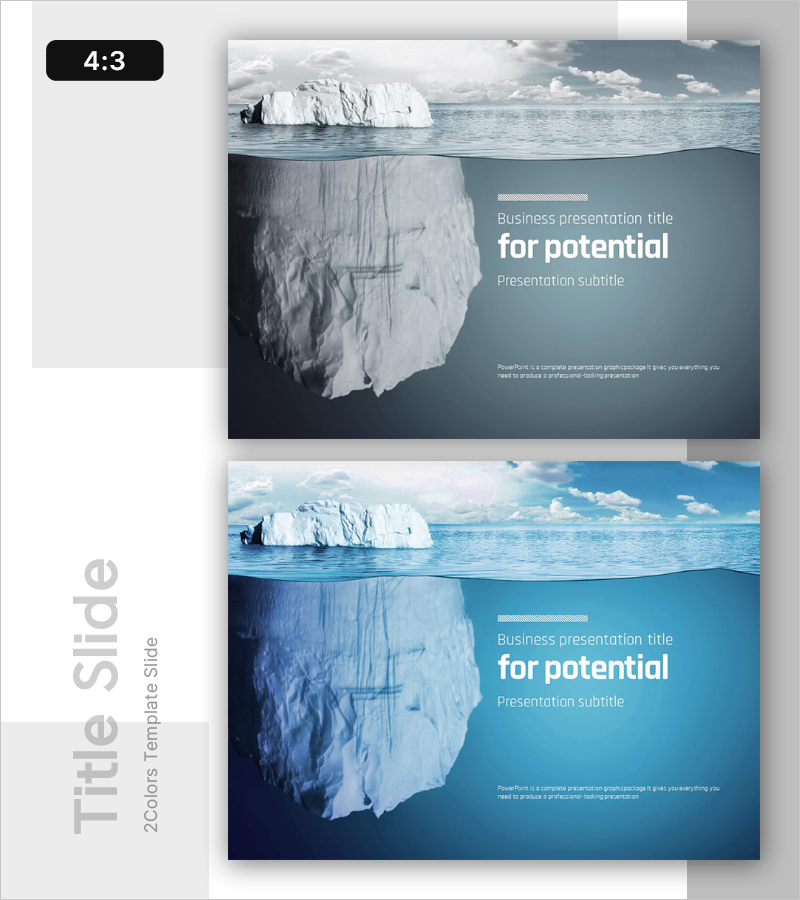
- # of Slides 2
- File Format PPTX
- Slide Ratio 4:3
- Color
Keywords
About the Product
This slide utilizes a horizontal bar chart to visually convey the distribution of donation usage items. The combination of brown, green, and yellow colors infuses both stability and vitality, ensuring clear comparison across each category. It's especially effective for materials used in CSR reports or fundraising campaigns, emphasizing the significance of different donation categories. Ideal for use by non-profits or CSR departments, this template allows easy replacement of text and graph with a medium level of editing difficulty, enabling rapid application in various presentations.
Related Products
-
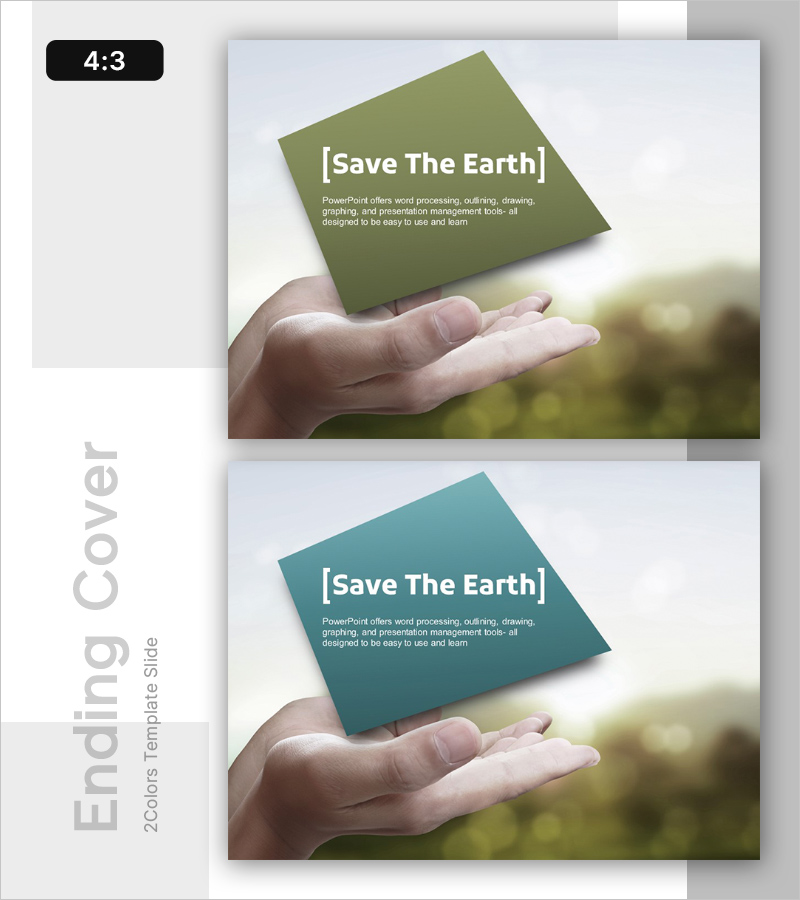
Eco-friendly Theme Ending Cover Template - Save The Earth
#Emotional Messages
-
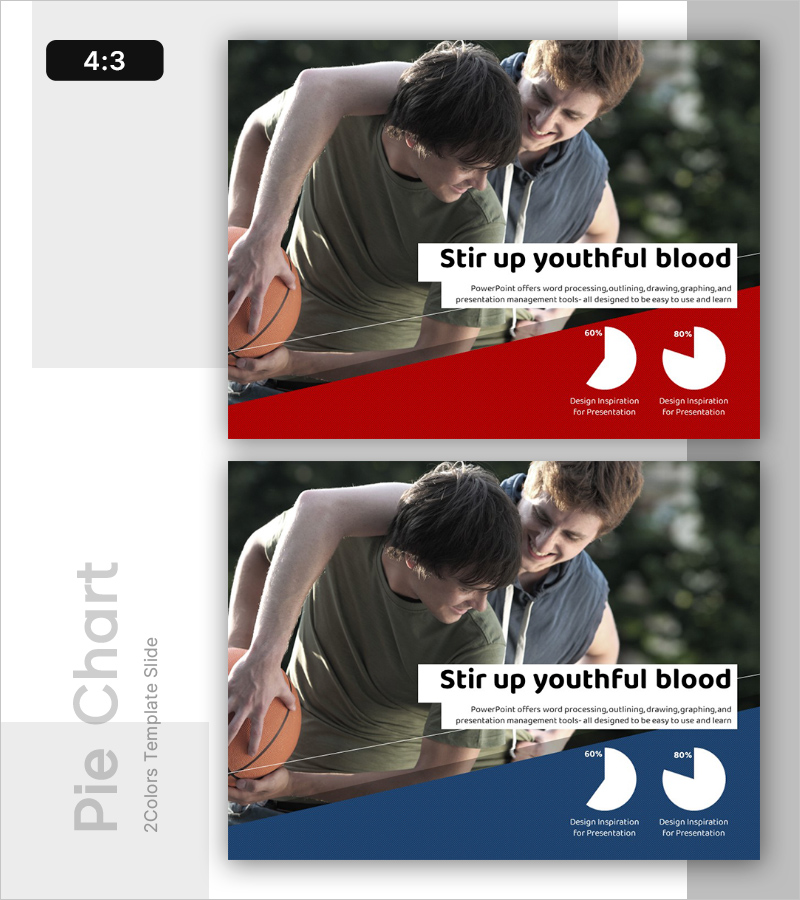
Why We Shine – Pie Chart Market Analysis Slide
#Emotional Messages
-
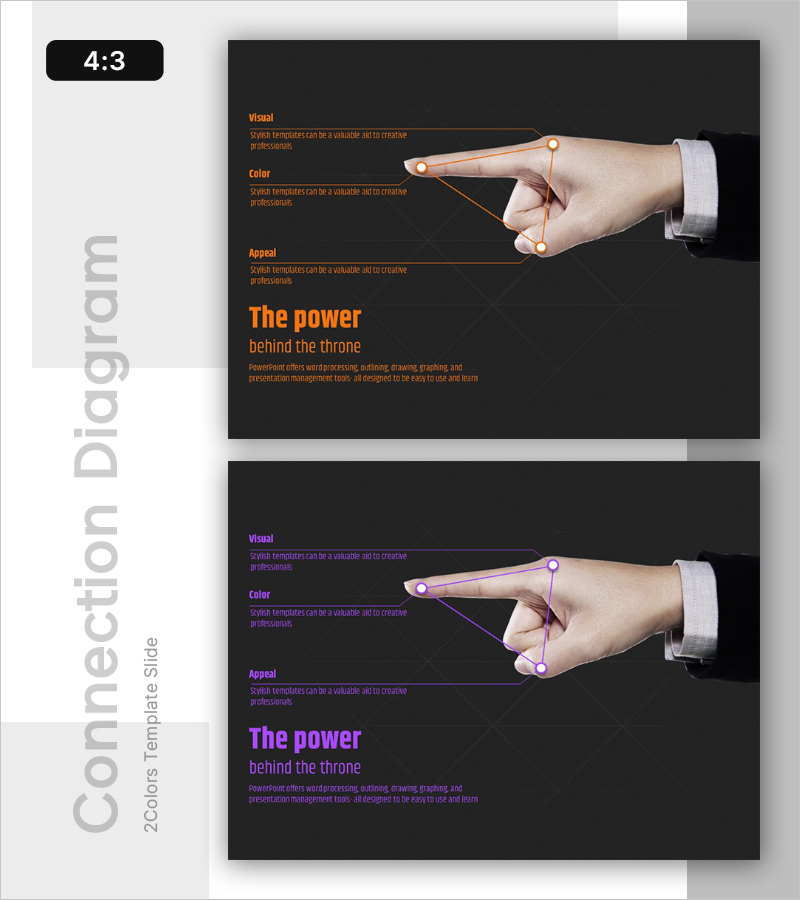
Visual Presentation Focused PowerPoint Slide – Design for Creative Professionals
#Emotional Messages
-
Possibility Template Cover – Capturing Business Potential
#Emotional Messages
