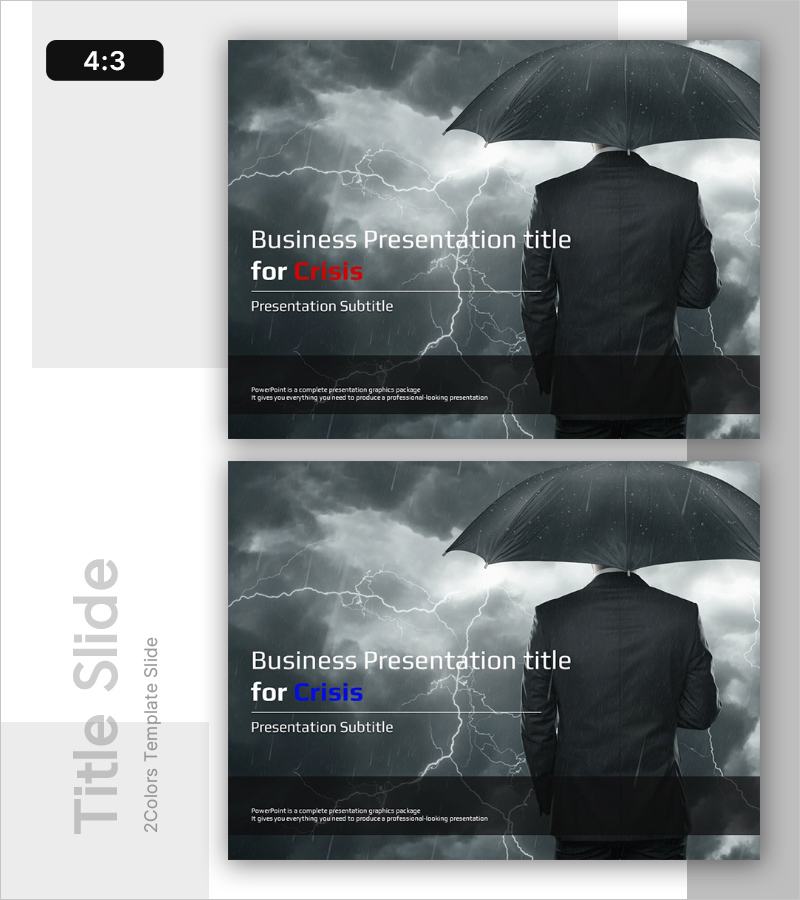
Emotional Messages
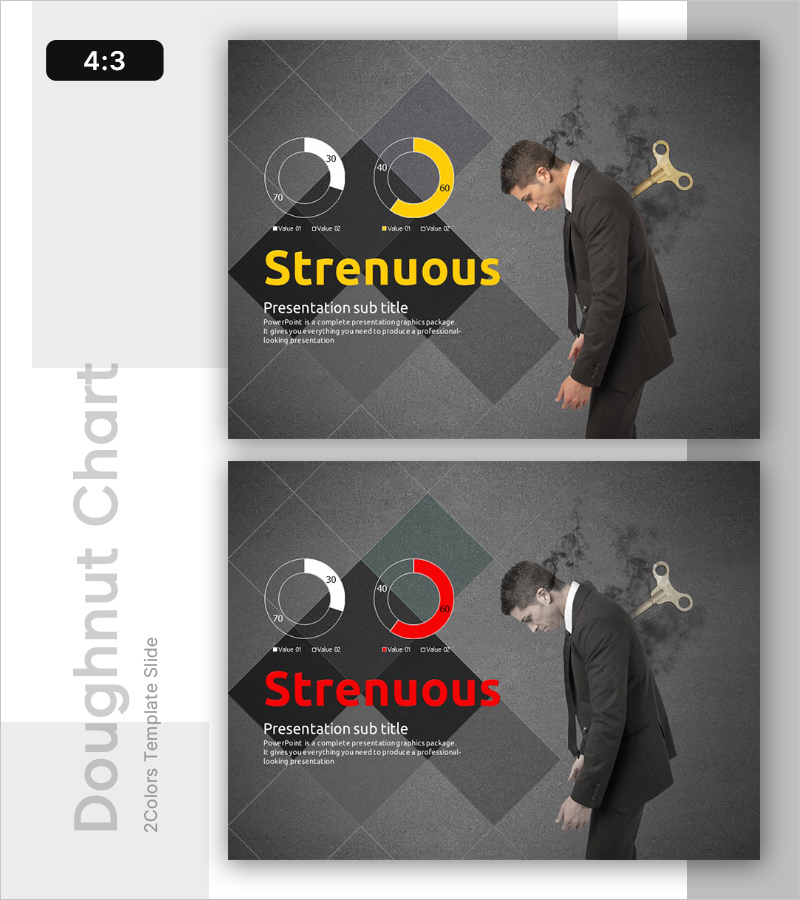
Stress Index Analysis Graph – Market Share Comparison
RL0100049_3
- Last Update 12/21/2025
- File Size 4.2MB
- # of Slides 2
- File Format PPTX
- Slide Ratio 4:3
- Color
Keywords
About the Product
This slide features a doughnut chart designed for visual analysis of the stress index. The contrasting colors of yellow and red clearly compare two data points, making it ideal for market share analysis and performance reports. The emotional message of 'Stress Index' is perfect for corporate performance reports, competitive analysis, and consumer studies. Its high visibility and intuitive design are standout features, composed of data elements and text. The editing difficulty of this slide is moderate, allowing for easy replacement of text and graphs for versatile use.