Emotional Messages
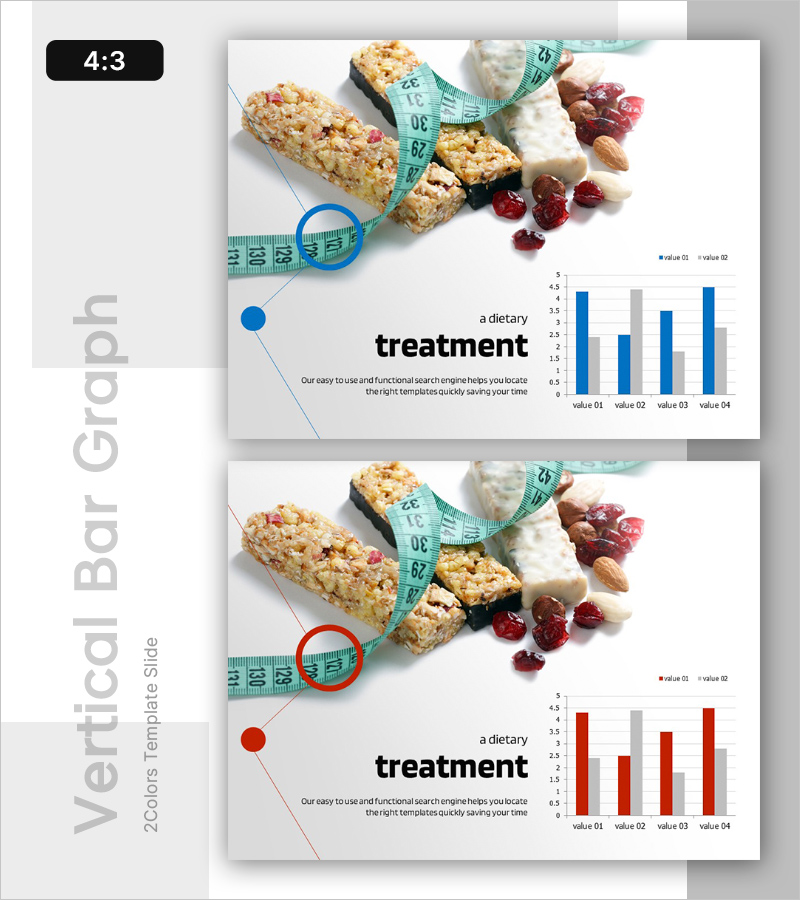
Diet Analysis Graph – Market and Competitor Analysis
RL0100024_4
- Last Update 12/21/2025
- File Size 1.2MB
- # of Slides 2
- File Format PPTX
- Slide Ratio 4:3
- Color
Keywords
About the Product
This slide features horizontal and vertical bar graphs centered on diet analysis, effectively visualizing market and competitor insights. Utilizing a sophisticated color palette of blue and red enhances data comparison ease, making it ideal for health management or nutrition-related projects. The visual elements emphasize dietary products while incorporating the theme of 'treatment' for a more engaging presentation. This slide ranks as 'easy' in editing difficulty, allowing for quick text and graph replacements.