Market and Competitor Analysis
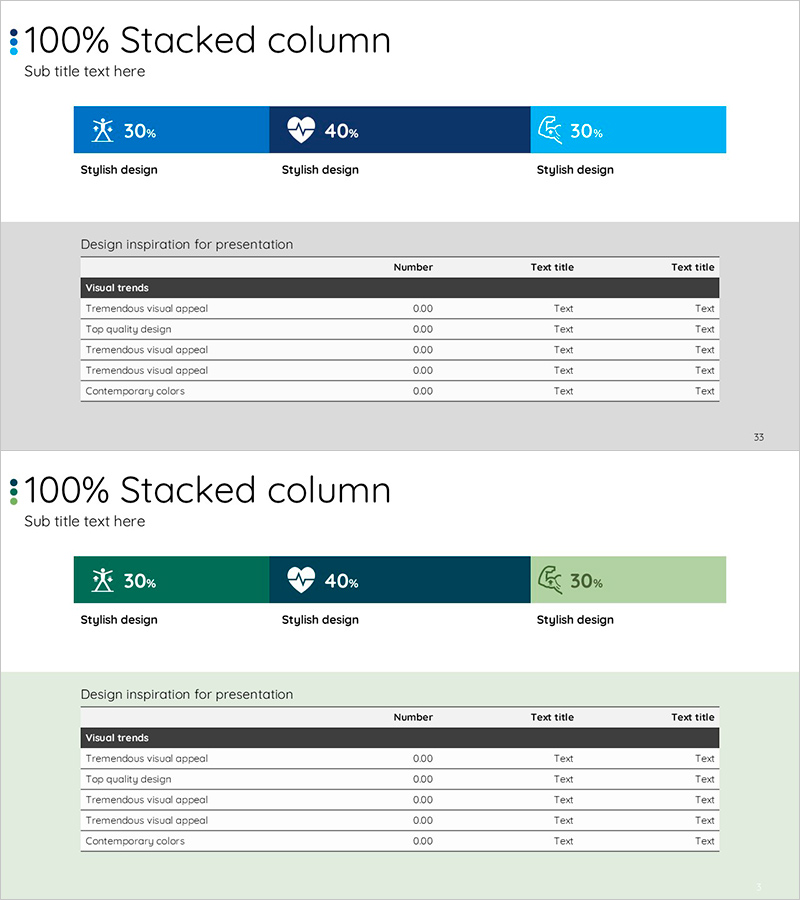
Segmented Horizontal Bar Charts and Tables – Optimal Data Visualization for Market Analysis
RJ0600017_32
- Last Update 12/21/2025
- File Size 0.2MB
- # of Slides 2
- File Format PPTX
- Slide Ratio 16:9
- Color
Keywords
About the Product
This slide utilizes segmented horizontal bar charts and tables to intuitively present market and competitive analysis results. The harmonious blend of blue and green colors conveys stability and trust, emphasizing visual representation of data. Users can effectively articulate complex market information and support insightful discussions and decisions. Target users include business analysts and marketing professionals, enabling them to create in-depth reports or engage in effective presentations. Text and data replacement is straightforward with an editing difficulty rated as 'easy', allowing seamless application across various presentation materials.
Related Products
-
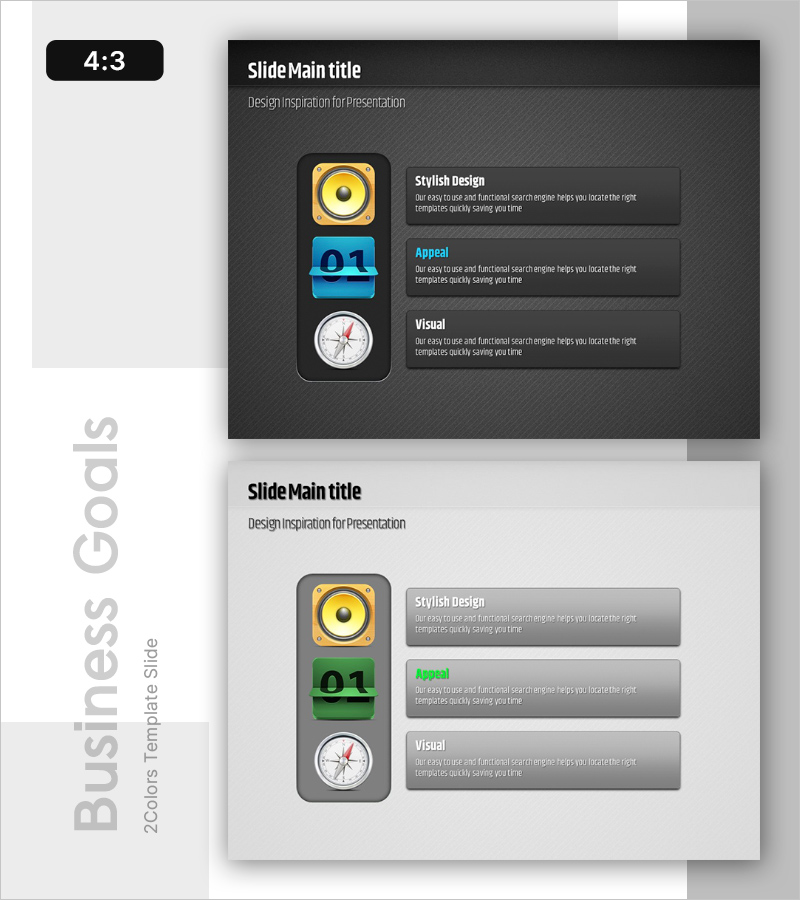
App Shape Closure Diagram – Business Strategy and Goals
#Business Vision and Strategy #Marketing Plan and Strategy #Diagram
-
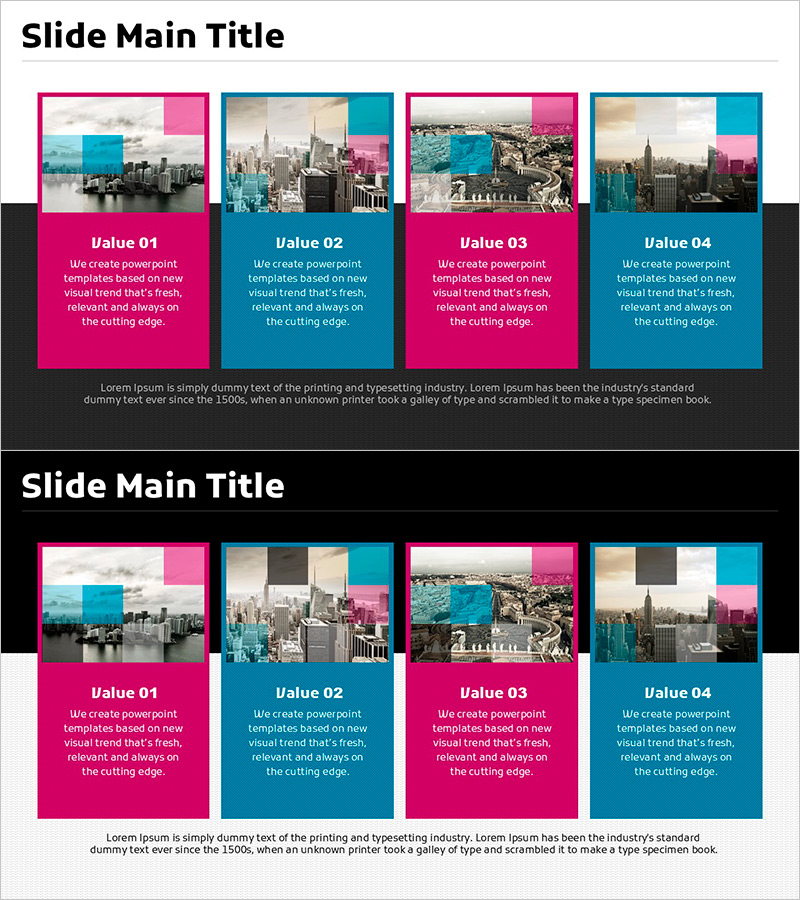
Cluster Diagram Slide for Market-Specific Strategy
#Marketing Plan and Strategy #Diagram #Marketing Objectives
-
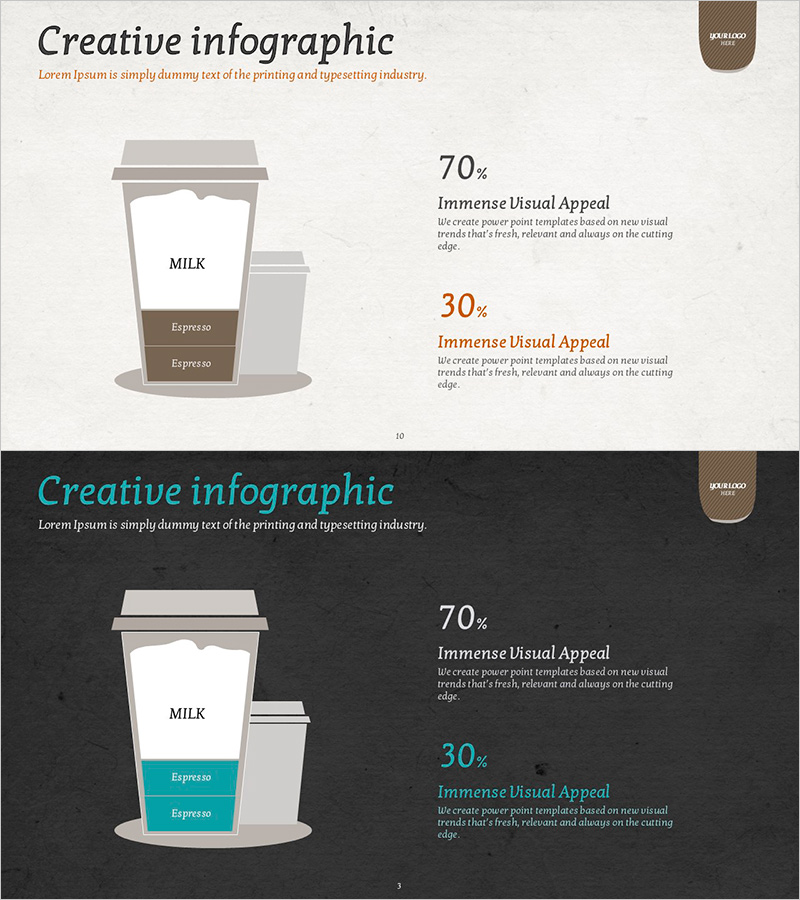
Coffee Composition Ratio Infographic – Visualizing Product Features
#Product/Service #Diagram #Features
-

Water Resources Utilization Diagram Template
#Product/Service #Business Vision and Strategy #Diagram
