Company Introduction
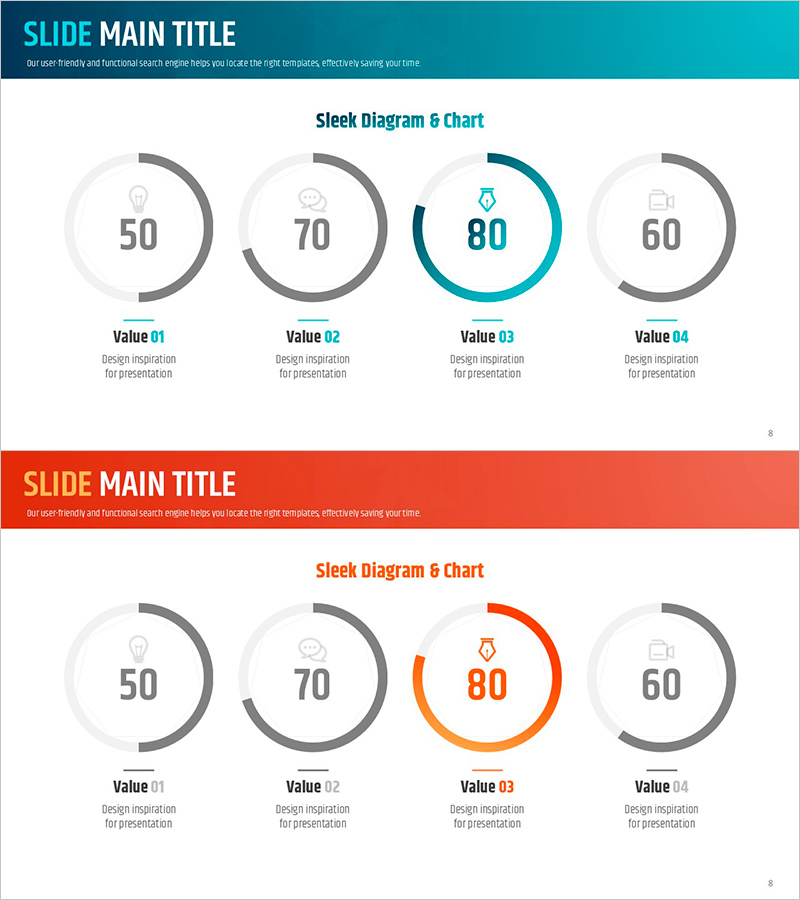
Ability Donut Chart for Performance Visualization – Emphasizing Key Achievements
RJ0600011_7
- Last Update 12/21/2025
- File Size 1.1MB
- # of Slides 2
- File Format PPTX
- Slide Ratio 16:9
- Color
Keywords
About the Product
This slide utilizes an ability donut chart to visually represent performance metrics in a premium presentation format. The circular structure of the donut chart distinctly illustrates each performance indicator, attracting audience attention with vibrant red, orange, and teal colors. It is ideal for presentations such as company and product/service overviews, conveying a sense of achievement and success through the theme of 'key achievements'. The text and numeric replacements are easy, with the editing difficulty rated as 'easy', allowing for quick integration into various business contexts.
Related Products
-

Origami Template for Vision Delivery – Innovative Marketing Strategy
#Product/Service #Marketing Plan and Strategy #Development Status
-
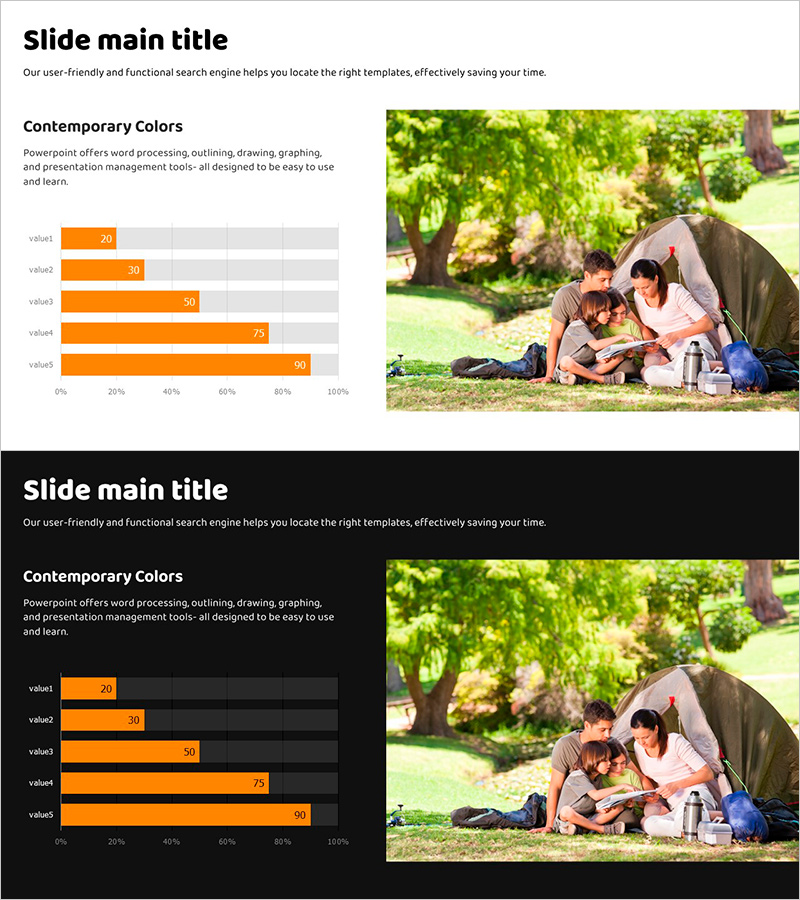
Family Camping Stack Horizontal Chart – Market Status and Competitive Advantage
#Market and Competitor Analysis #Graph #Market Status
-
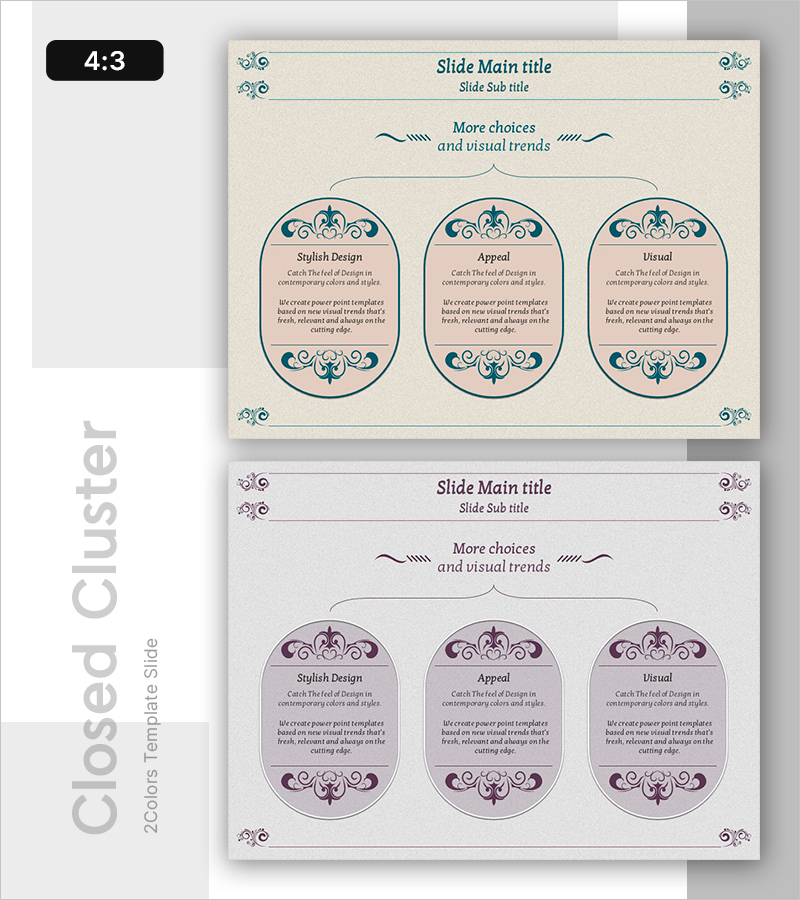
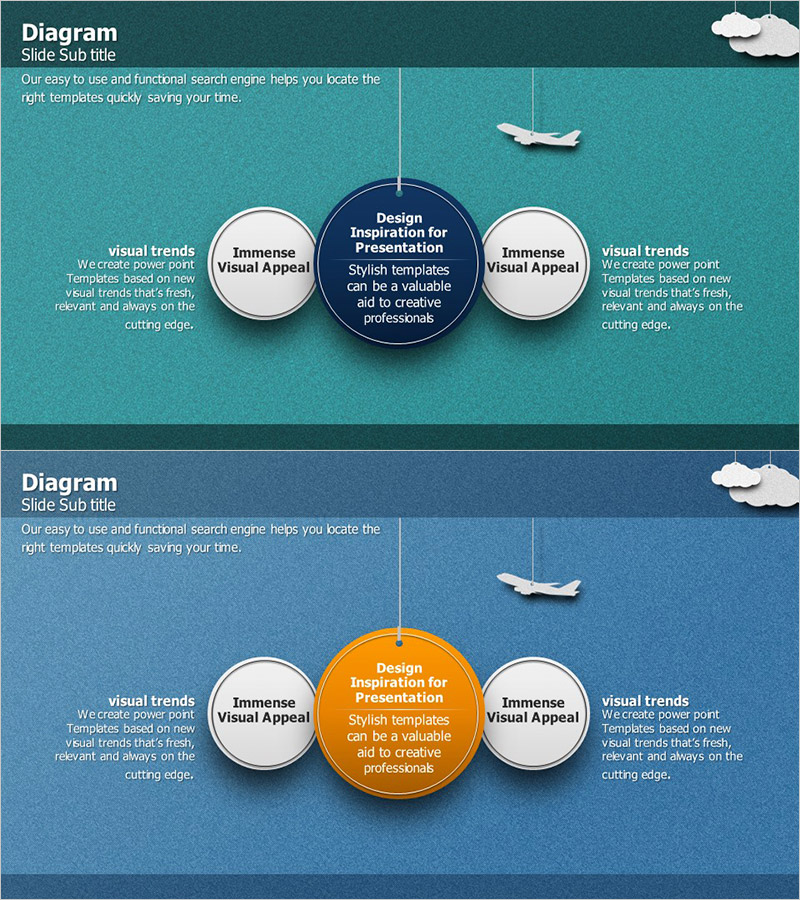
Antique Closure Diagram – Product and Service Introduction
#Product/Service #Technology Sector #Diagram
-
Business Core Competency Circle Diagram – Cluster and Closed Structure
#Product/Service #Business Vision and Strategy #Diagram
