Financial Plans and Performance
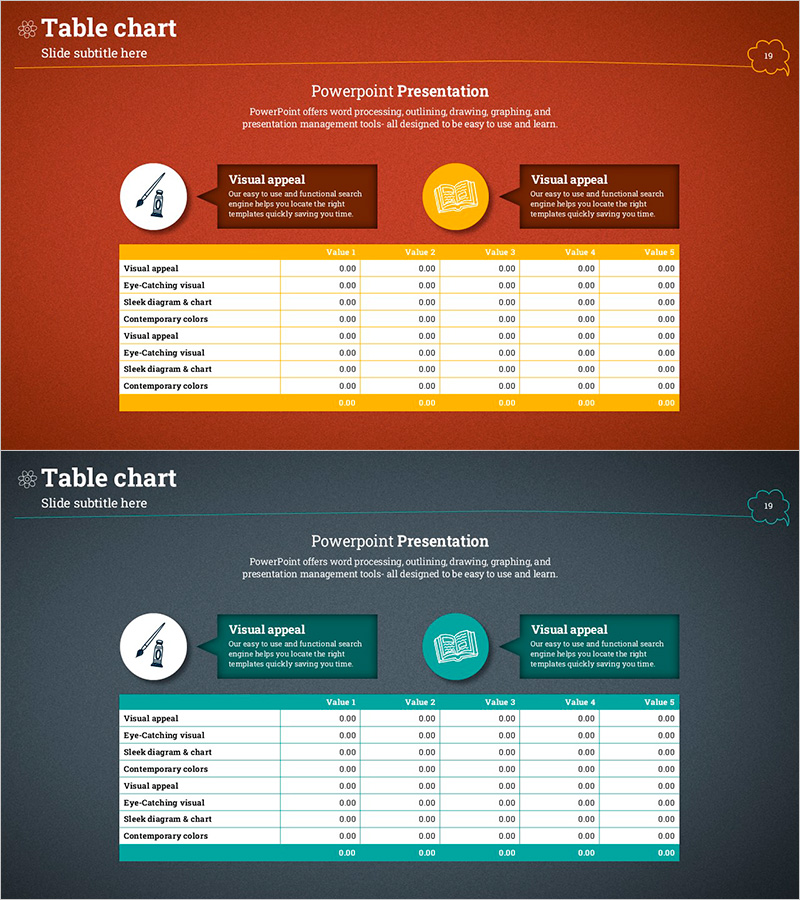
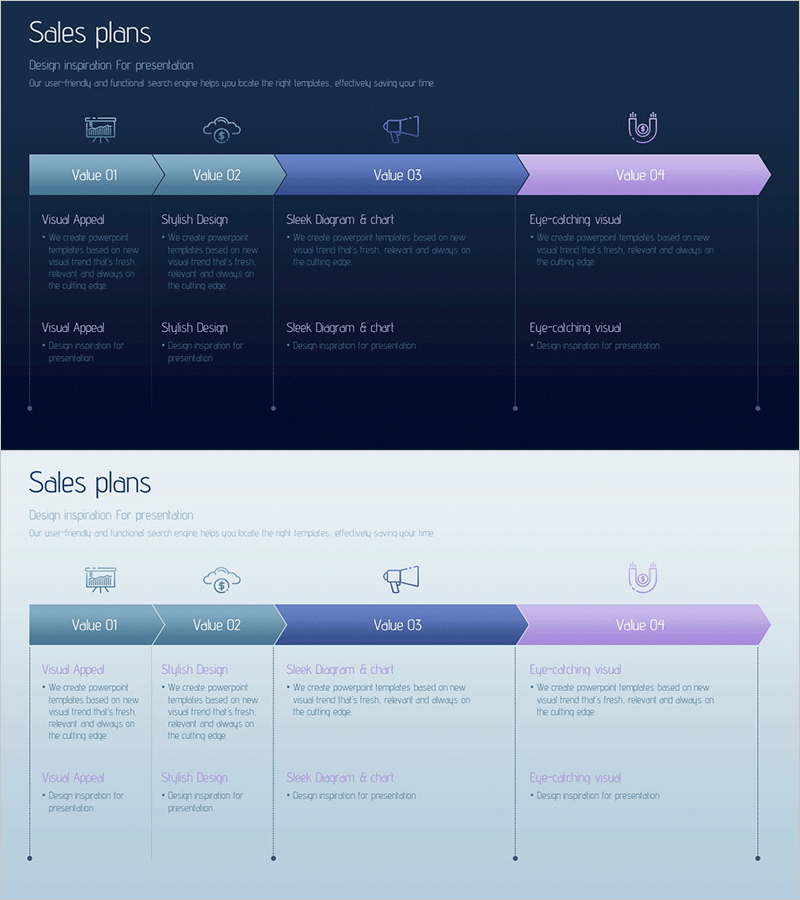
Table Chart and Descriptive Text – Visualizing Sales Metrics
RJ0500014_18
- Last Update 12/21/2025
- File Size 6.1MB
- # of Slides 2
- File Format PPTX
- Slide Ratio 16:9
- Color
Keywords
About the Product
This slide features a table chart that visually presents sales and revenue items. With a harmonious blend of orange and teal, it maximizes visual appeal, making it effective for information delivery. It neatly organizes financial plans and key performance indicators, making it immensely useful for business reports or presentations. Users can easily replace necessary text and data, with an editing difficulty rated as 'easy', enabling quick adaptation to various presentations.
Related Products
-
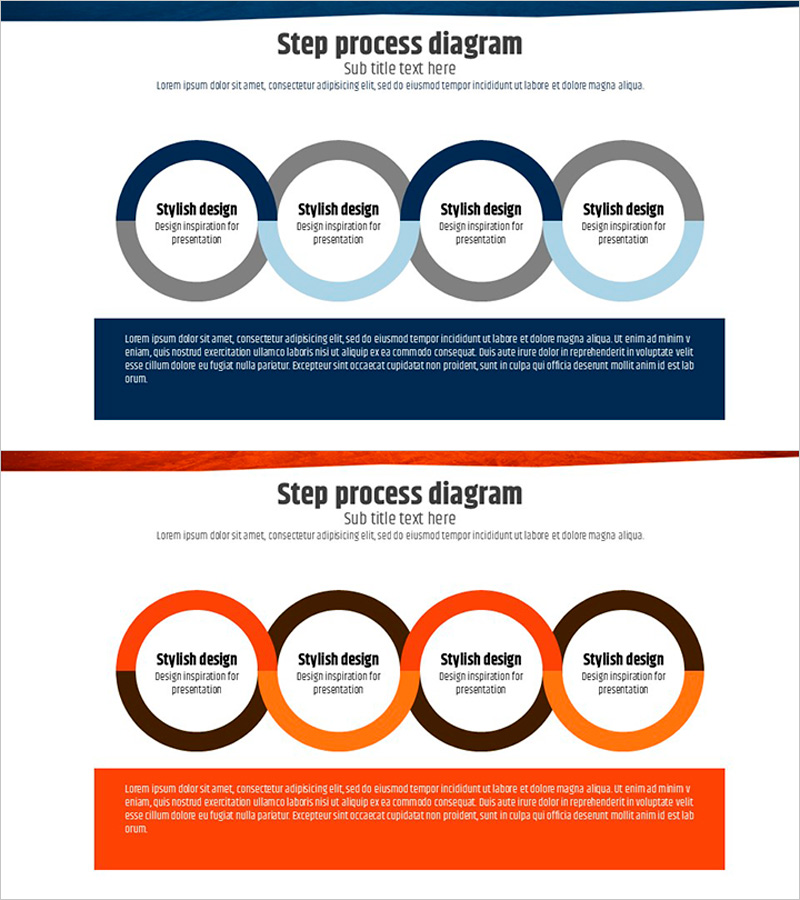
Blue Orange Connection Diagram - Business Strategy
#Business Promotion Strategy #Business Management #Diagram
-
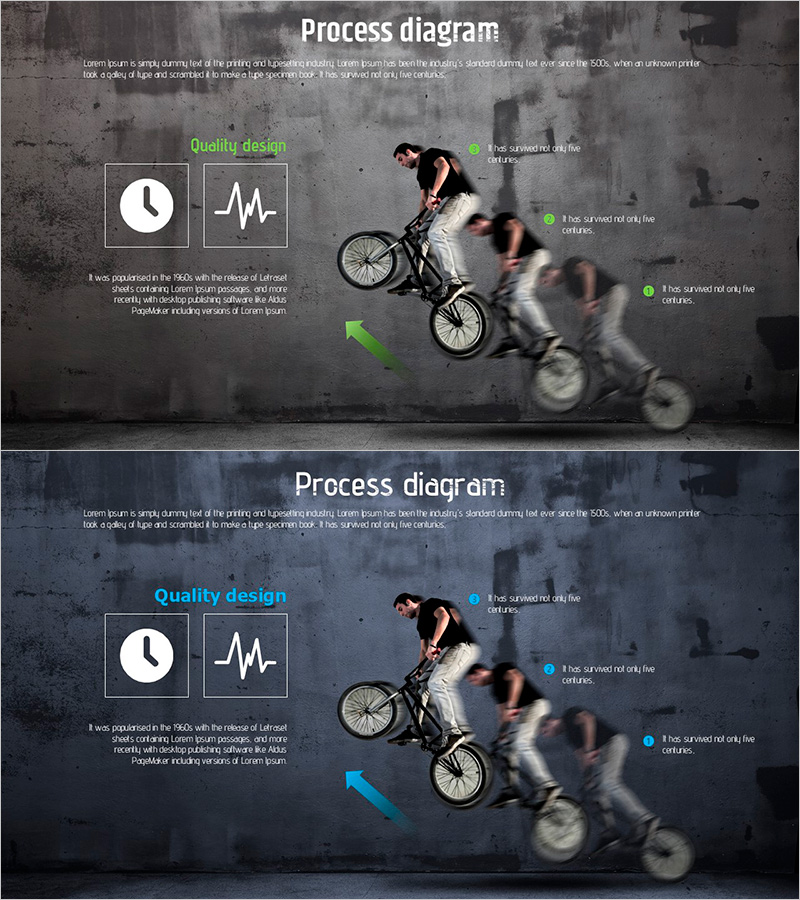
Extreme Sports Jumping Diagram – Dynamic Flow and Structure
#Operation Plan #Diagram #Production and Technological Development Strategy
-
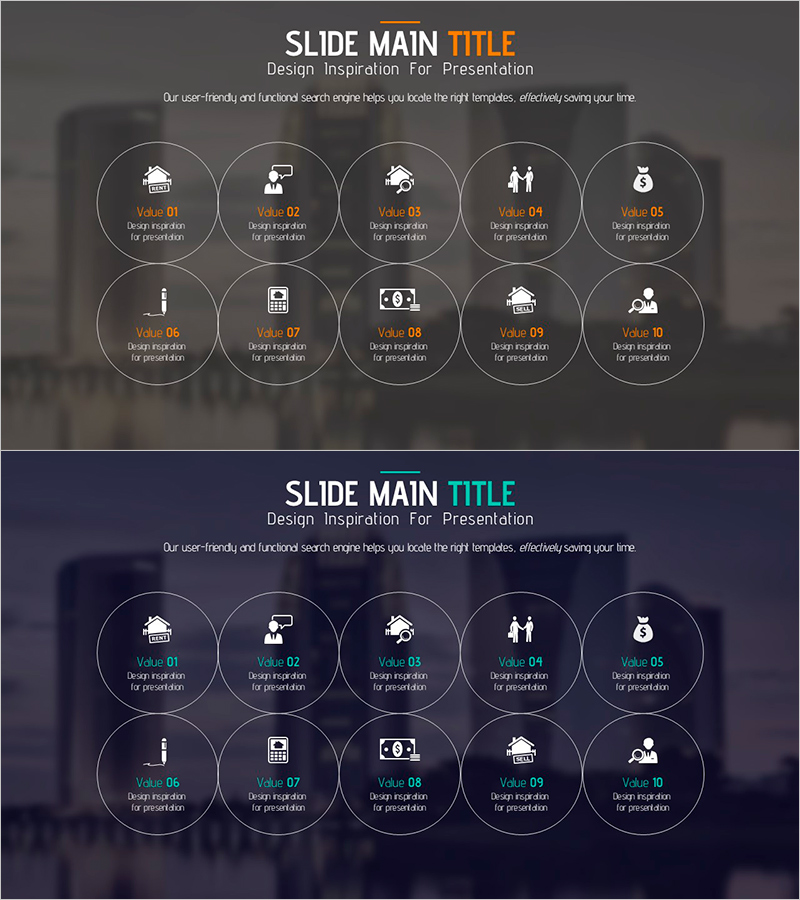
Collection of Advantages and Configurations PowerPoint Template – Operational Plan and Cluster
#Product/Service #Operation Plan #Diagram
-
Sales Plan Linear Diagram – Effective Business Strategy Development
#Business Management #Marketing Plan and Strategy #Diagram
