Market and Competitor Analysis
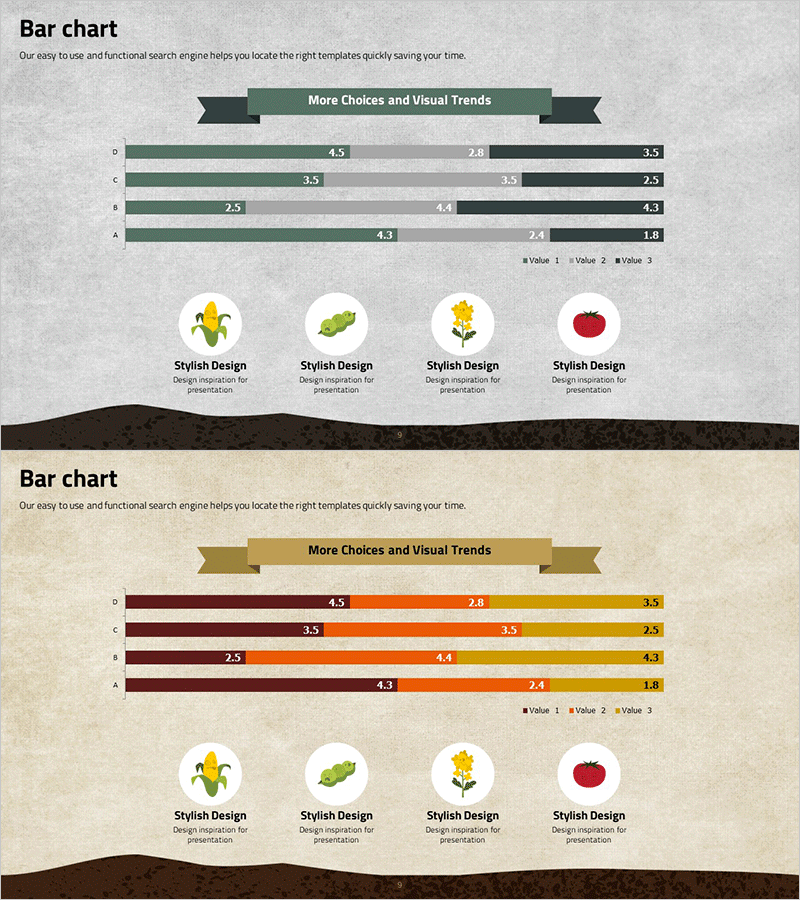
Crop Analysis Detailed Bar Graph – Insights into Market and Competition
RJ0400031_8
- Last Update 12/21/2025
- File Size 8MB
- # of Slides 2
- File Format PPTX
- Slide Ratio 16:9
- Color
Keywords
About the Product
This slide features a detailed bar graph designed for crop analysis, allowing for an easy comparison of various crops and competitive data. Its clean design and intuitive layout make it easy to recognize the performances of each crop, enhanced by vibrant yellow and green colors. The combination of green, yellow, and gray conveys stability and nature, making it ideal for agriculture-related presentations, reports, or proposals. Clear data labels are prominently displayed, and the editing difficulty is rated 'easy', enabling various users to quickly customize it to their needs.
Related Products
-
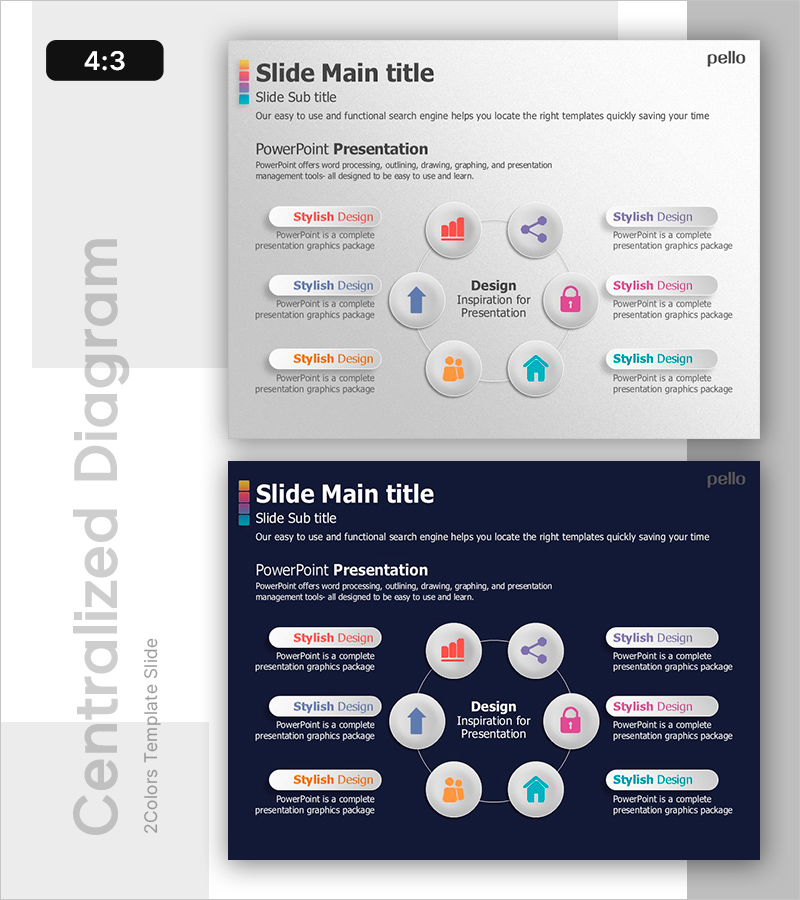
Core Service Features at a Glance – Business Vision and Strategy
#Product/Service #Business Vision and Strategy #Diagram
-
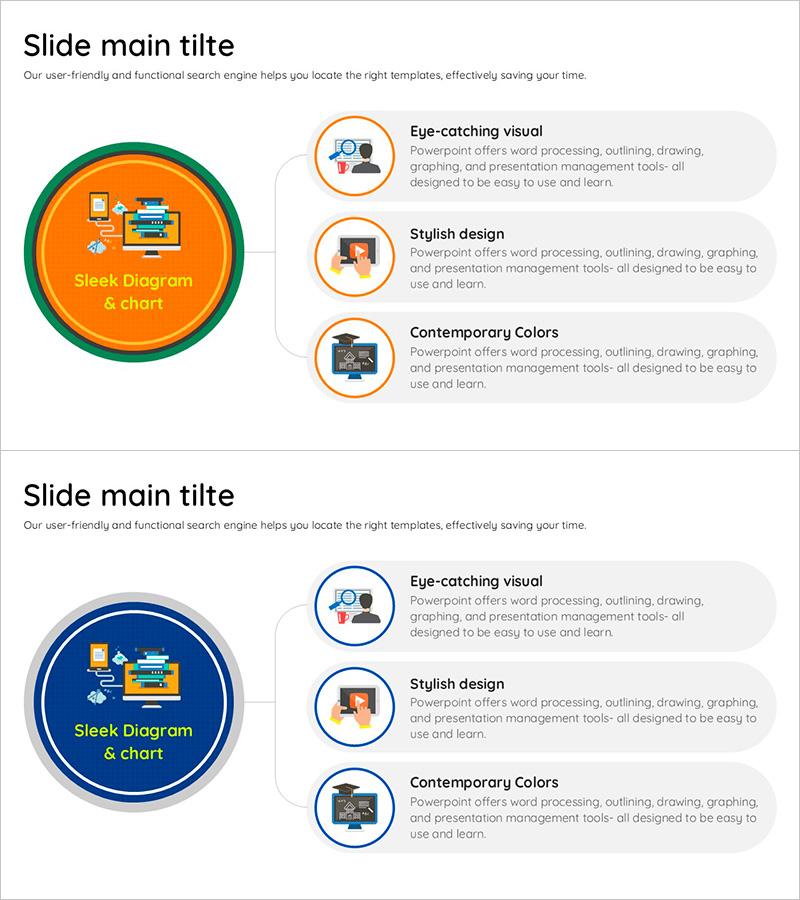
Diagrams of the Spread of Online Education – Effective Information Delivery
#Product/Service #Diagram #Product/Service Introduction
-
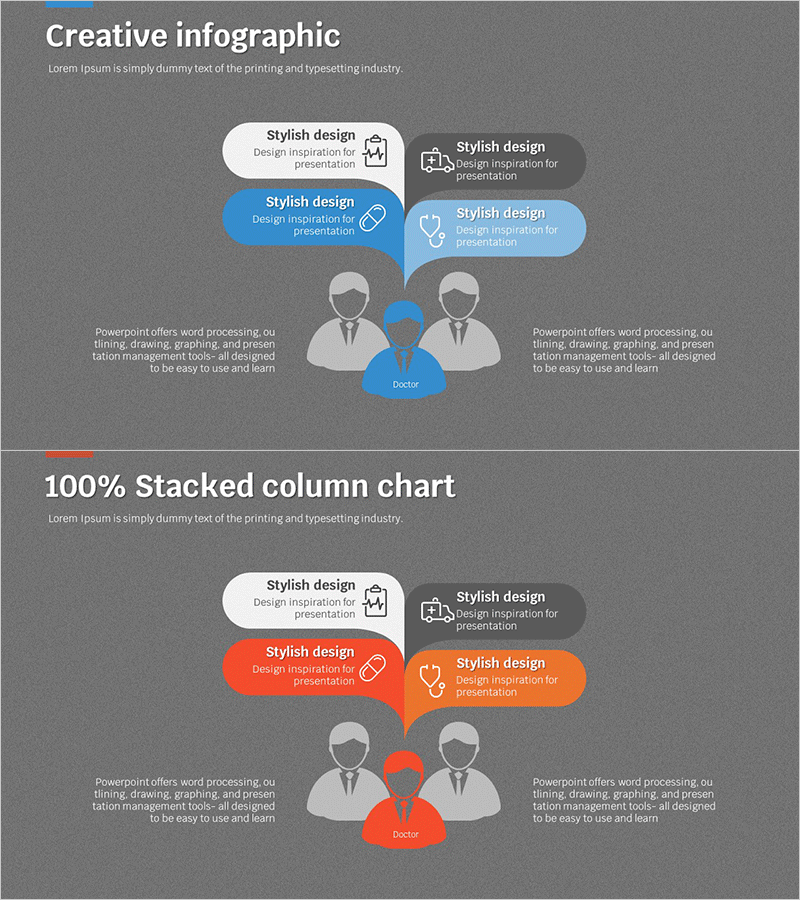
User Feedback on Medical Business Slide – Visually Clear Customer Analysis
#Market and Competitor Analysis #Customer Success Stories #Text Box
-

Differentiation Strategy of the Interior Market
#Product/Service #Marketing Plan and Strategy #Diagram
